Personal Dashboards for Self-Tracking Data

This may be a foolish suggestion as I’m over my head technically, but would there be a benefit in “joining forces” using the Open Humans platform to collaborate on dashboard development in a notebook anybody can run?

2 Likes

I’d be interested in a virtual conference! Happy to volunteer some time as well to make it happen.

1 Like

Good discussion in this post. I am searching no. of sites for tracking data information. I never got this data. Finally i get here the complete useful information regarding personal dashboards for self tracking data. thank you for sharing.

If you’re interested in correlations, a hot startup is Bioloop Sleep for improving your performance by focusing on sleep patterns. For Fitbit, Oura and Apple Watch. Worth a look!

The goal was originally the same as yours, but focus is paramount in QS dashboards.


1 Like

Hi Kastan, I agree that focus is important if the goal is to create a product that has a clearly understandable and standard use case to support success in a crowded field of other products. But many personal dashboards aren’t products, but resources for a personal workflow. In that case, they may benefit from being more general purpose aggregators that allow their creators/users to shift focus over time. (What if you wake up tomorrow aren aren’t so interested in sleep anymore?)

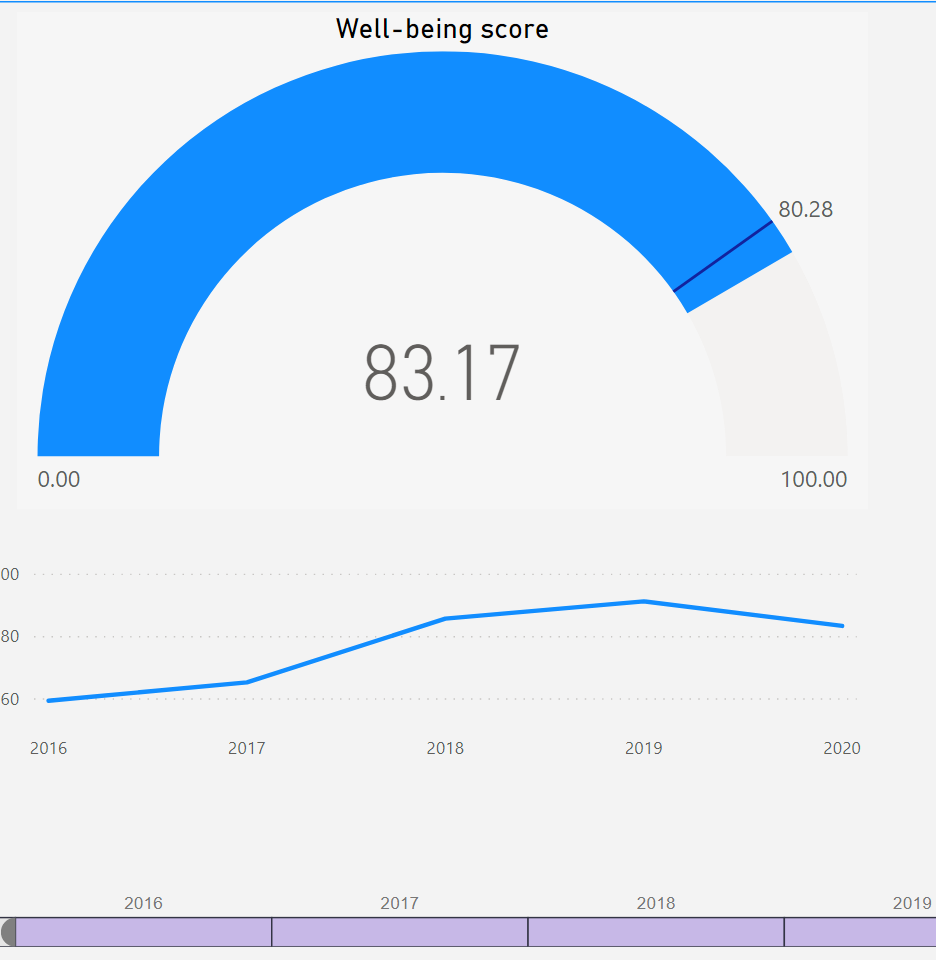
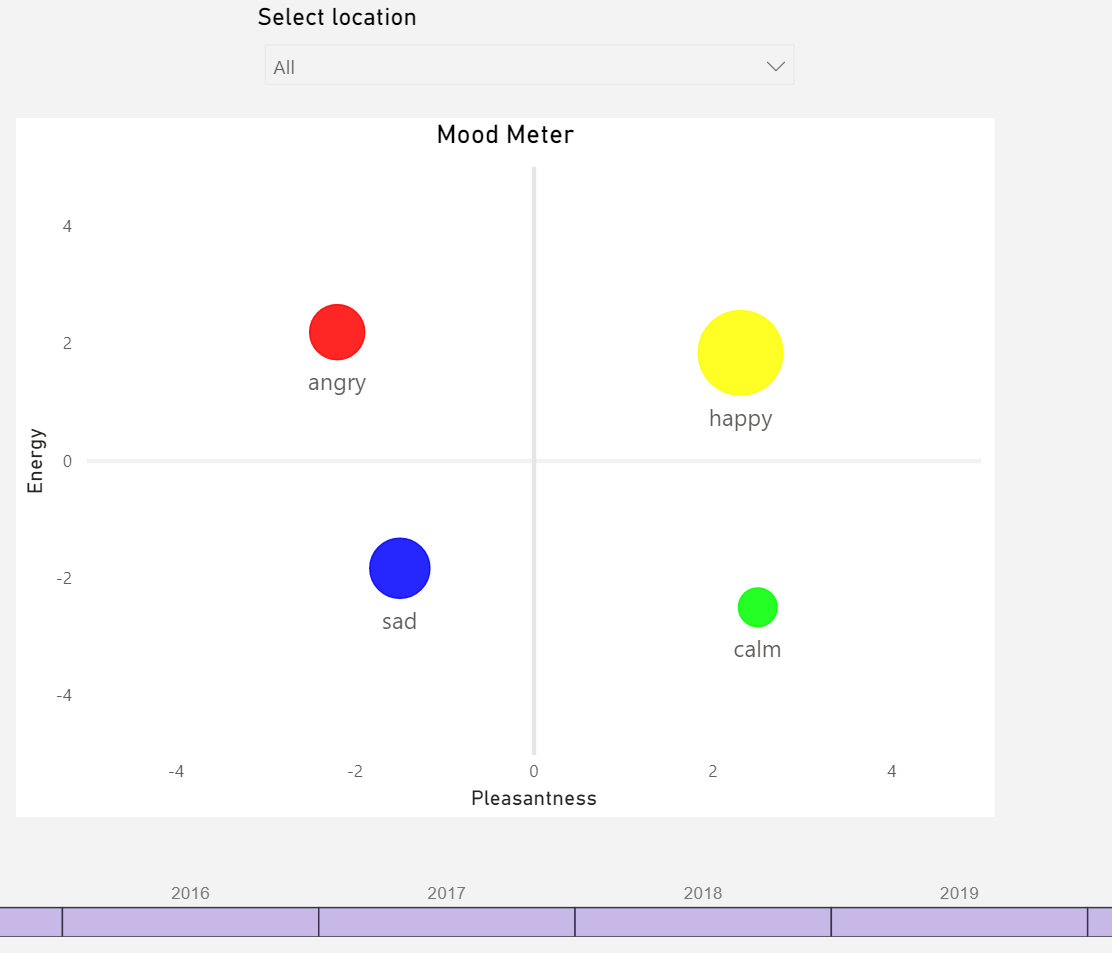
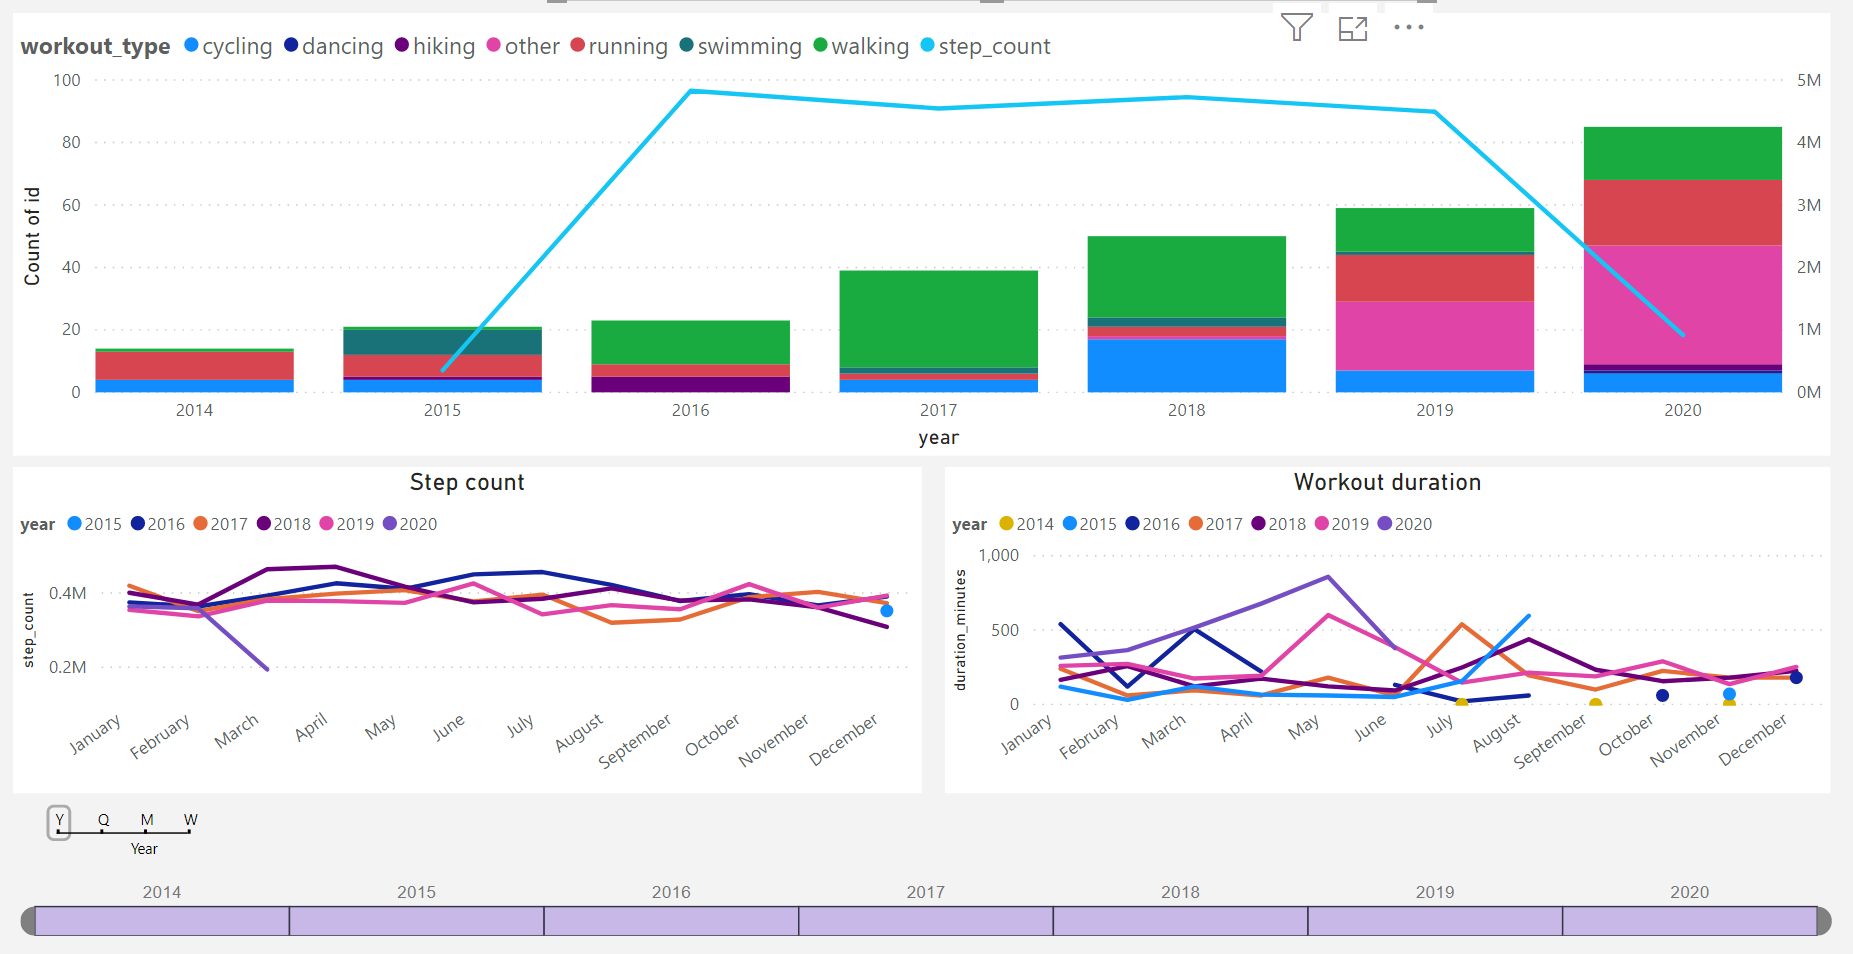
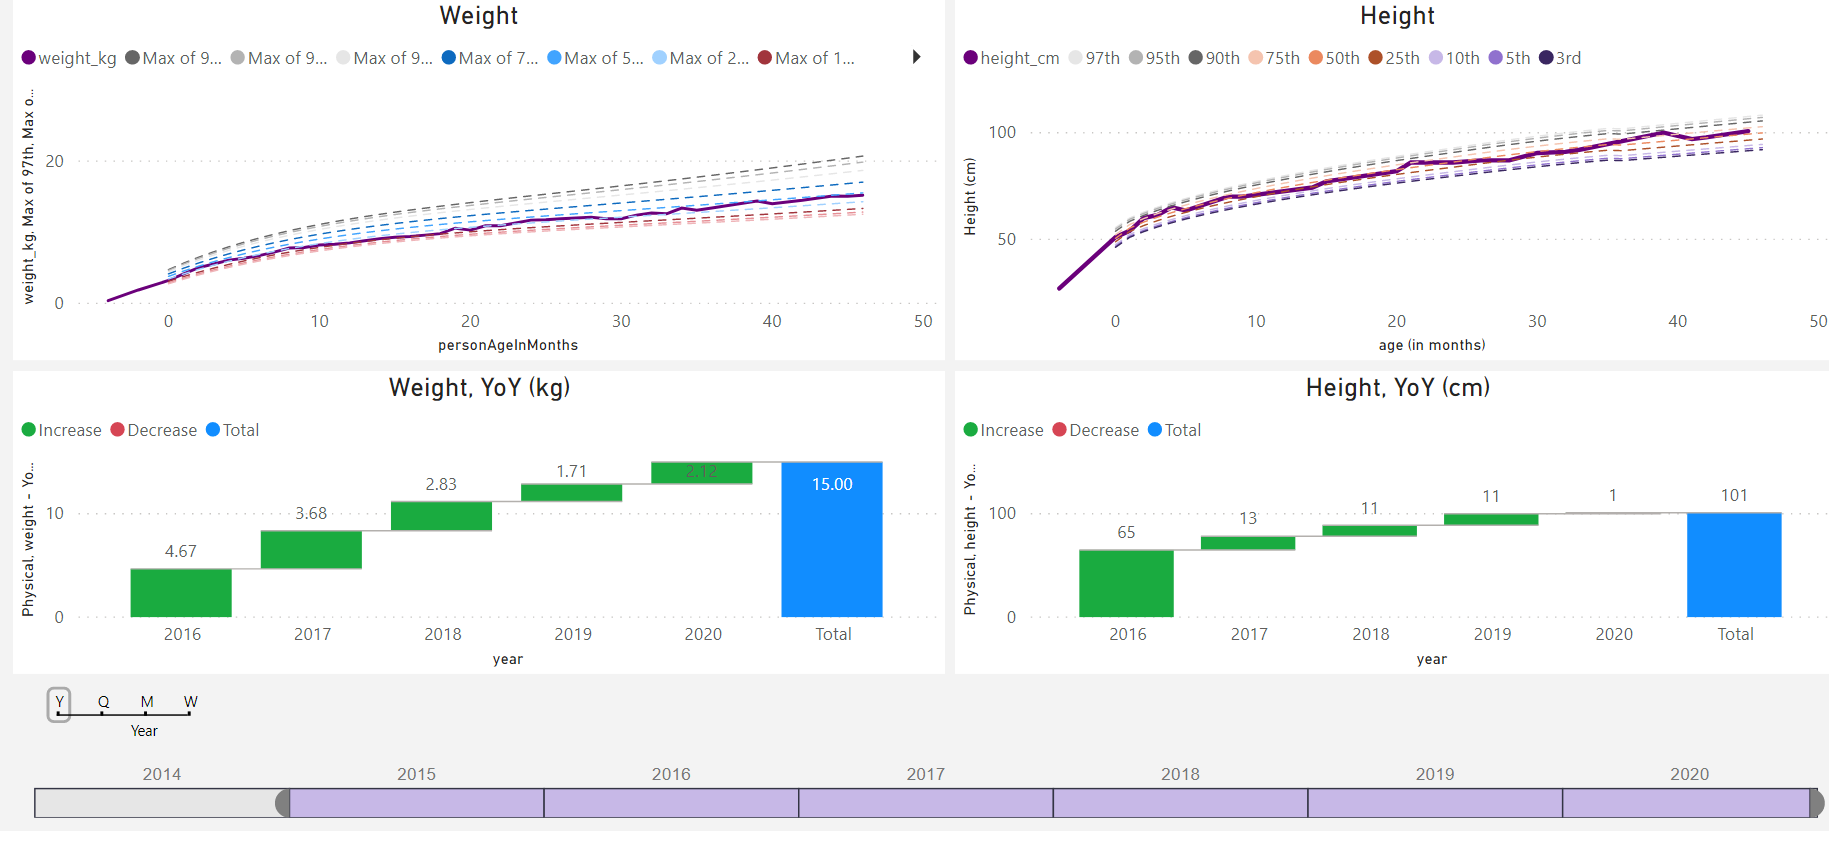
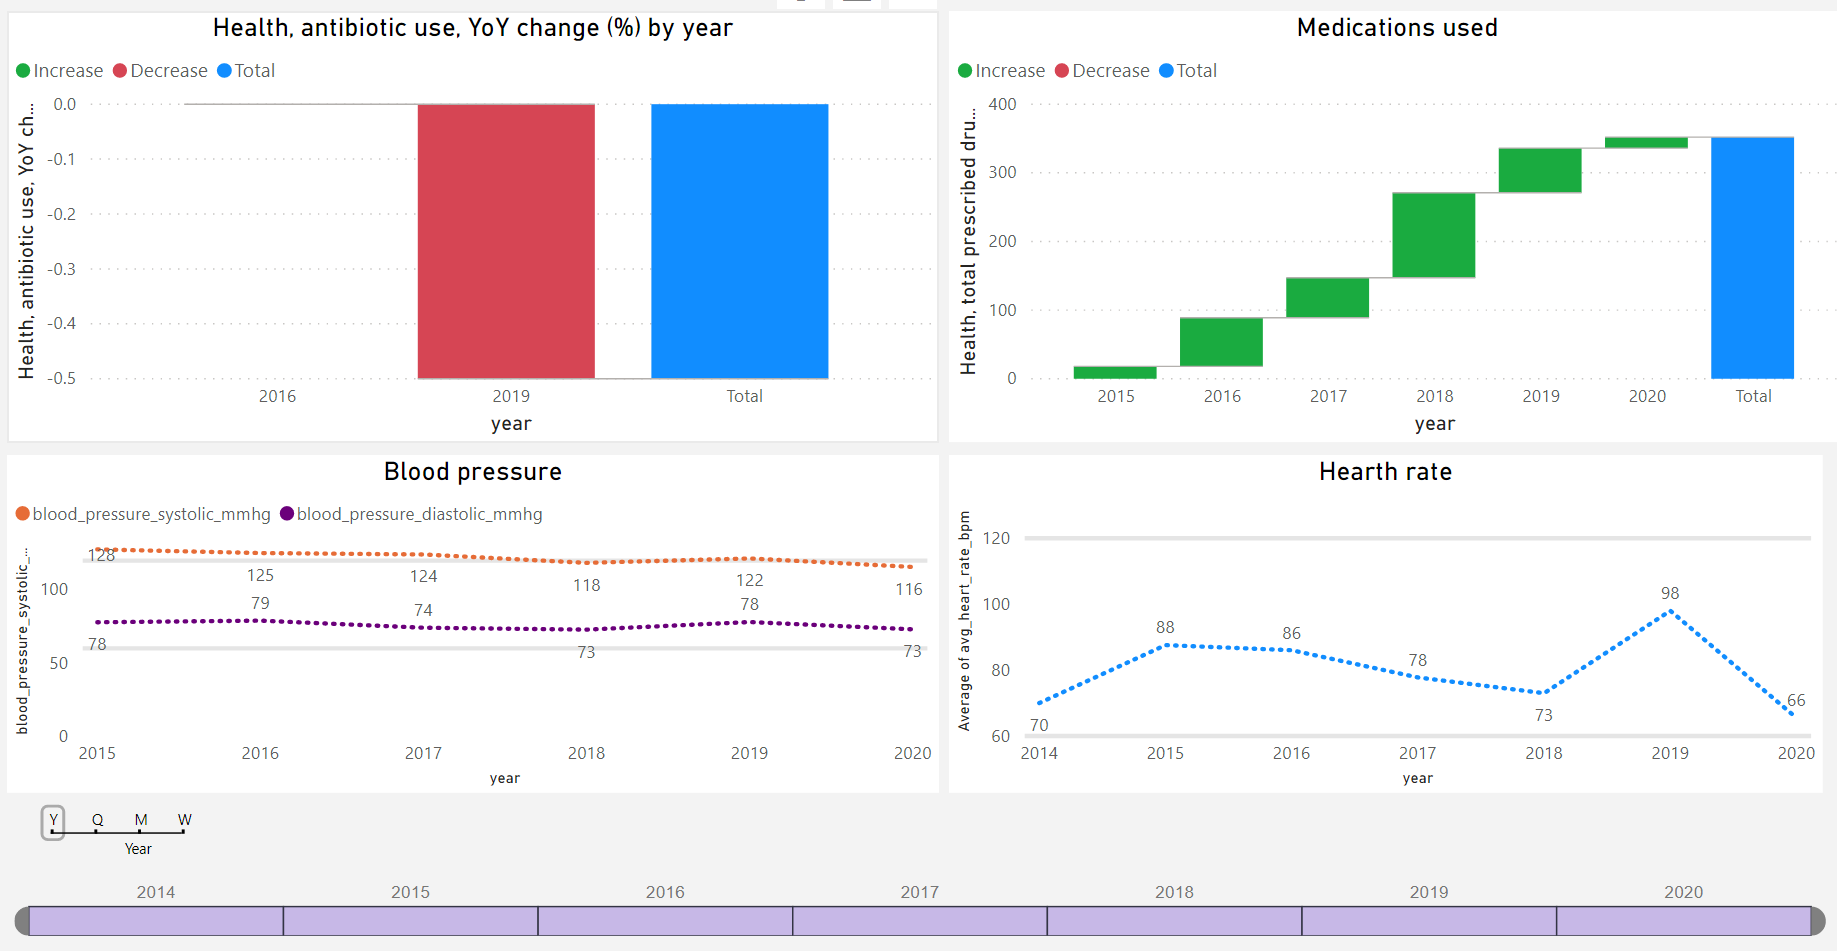
Here are some of the self-tracking dashboards I have been using since 2015. Most of the data is observed by me and recorded manually - some tracking dimensions contain data for all members of my family. Dashboards are built using Power BI connecting to data hosted in a cloud-based SQL server database.

6 Likes

Love the dashboards @Sergio! Are they available publicly anywhere?

I recently started playing around with various ways to visualize my data as well, inspired by many of the posts here. It’s unexpectedly difficult to present the data in a clear yet informative fashion.

You can play around with it here: https://alexey.io

4 Likes

I’m interested

How can we flag the post? I want to keep it

I undeleted my post, no need to flag it. I just hadn’t seen anyone else posting “I’m interested” in this thread, so I thought I had responded incorrectly. Would love to see something along the lines of what you’re proposing to build!

Hey LarsNyborgPedersen,

Answering some of your questions:

Would it be best to put it in a .CSV

It seems like CSV is the most universal format now (at least for such kind of that), so I’ll bet on it.

Would there be any benefits to making this a local desktop app instead of a webapp?

Of course. If you’ll decide one day to switch over from Macs to Windows (or otherwise) - web application has you covered.

Are there more automated ways to get data from my 5-8 different trackers to my webapp? Not all of them have public API’s.

That’s true - some of them are not public, some of them are public but you have to pay for the REST API data access (and I think it’s fair taking into account that storage and processing can cost plenty). I’d stick to one platform that allows you to backup/export data to CSV anytime you want.

Hope that helps

I’m still thinking about creating this in Python.
I don’t know if I’m going to create it as a local app for myself only or as a commercial web app.
I also don’t know which technologies I’ll use. Dash or React.js or something else.

If I start out coding it as a local app will it then have to start all over if I later decide to make it a commercial web app?

What are dashboards for? It cant be analytics or correlation finding.

I would like the dashboard to see a graph with the last week/month/year of data for all variables I track.
Then I will hopefully be able to spot patterns.

But I would also be able to quickly put two variables on the same graph or maybe find the correlation.

Now I’ve been trying to design wireframes/mockup for the Dashboard I envision!

You can watch me walking through my prototype in this video!
Otherwise, you can try the prototype here!

Otherwise you can see some screenshots here:

Dashboards:

  • Create MANY dasboards and customize each box:
    • Graphs
    • Pie charts
    • Average value

Visualize:

  • Visualize two or more variables as:
    • Scatterplot
    • Time series
    • Heatmap
    • Bar chart
  • I haven’t decided how you should be able to customize the graph yet…

Data import:

  • Import data:
    • Integrations (Oura, RescueTime, Google Fit, fitbit, Withings, Google Calendar, Cronometer)
    • Manual upload of .CSV
    • Maybe also public API?

The reason I don’t use the existing solutions are:

  • I track with the Android app “Track & Graph” and NOBODY supports it…
  • I want to see percentage of time in each of my Calendars as a pie chart.
  • Since I track so many variables I want to create multiple Dashboards.
  • I want to quickly put any two variables on a Graph/Scatterplot to explore my data
  • I’m looking to automate the import of data somehow

What do you think of this solution? Would you pay subscription for it if it contains the trackers that you use?

2 Likes

Hi Lars,
Nice job with the prototype - a live version of the data source integration screenshot would be valuable to many.

What do you think of this solution? Would you pay subscription for it if it contains the trackers that you use?

I wouldn’t but let me explain. I think many people in this QS community have cobbled together similar solutions that work for them including myself. From a solution standpoint, the big hurdle used to be the knowledge and skills to actually build something. But with the current batch of self-service analytics tools from the major tech companies, those hurdles are no longer there. This is to say that the value proposition has to be much more than solving the problem of data integration, analysis and visualization.

There’s a screen shot missing form your post - it’s the one that demonstrates the solution’s unique ability to turn tracker data into insights that inform (i.e. beyond descriptive analytics) an individual’s quest for self-improvement (or whatever the goal may be). In your prototype, what would that screenshot look like?

Sergio

1 Like

Which self-service analytics tools from major tech companies are you talking about? :slight_smile:

I’m not sure my app would include insights, other than the ones the user can find by himself in the “visualize” section of the app.
I tried some platforms that give insights based on my data, but I never felt I could trust the insights, because I didn’t knew where the data was coming from and what methods they were using to extract the insights.

It’s a growing list that includes Power BI, Tableau, Data Studio, Qlik and more. These tools have come a long way in terms their accessibility to non-technical folks and this should continue in the years ahead.

I feel the same way which I think goes back to the uncovering a solid value proposition for tools in this space - what capabilities will help us overcome the credibility/trust/transparency barriers so we are willing to pay for them?

Sergio

I’m interested!

What do you think of this solution? Would you pay subscription for it if it contains the trackers that you use?

I think https://gyrosco.pe has this market nailed pretty well. They’ve been around for a while now and easiest way for non-technical folks to get started with quantified self.