Tracking body temperature

Mbientlab.com’s devices are quite small and could easily fit in an armpit. They sell things that could keep it there. I think Oura measures peripheral temperature more. That is also useful (not for fevers) so long as ambient temperature outside the body is also recorded.

I use one of these! I came to QS with this data first in mind.

I use a device called iThermonitor that measures core temperature (not skin temperature). It is made by Raiing and was designed to be used in hospitals for continuous, noninvasive core temperature monitoring, and multiple studies have demonstrated clinical accuracy. While there are lots of interesting applications in the hospital setting, as a consumer you can buy one from a reseller/licenser. The packaging varies but the device itself has a consistent design and the product name or description includes “iThermonitor” or has matching specs.

It is a small plastic sensor you keep under your armpit using an adhesive patch. It measures your temperature every 4 seconds and syncs with apple health.

I got mine under the name “FeverFrida.” I appears that it was licensed to a childcare products company, and parents are using it to monitor infant temperatures during illness so they don’t have to wake them up as often.

Drawbacks:
It is difficult to place it consistently- it does make a difference in the reading.
Having to reapply the patch so often (Although I just stick it in my bra)
The use cases it’s sold for and the study conditions don’t match the realities of regular adult life.
It seems like it has become difficult to find to purchase.

That being said, it’s fun and potentially useful data. Even if you do not place it consistently day to day, if it stays in place you may have an accurate trend for the day. I like to collect data points via oral thermometer as well from time to time to figure out what adjustment I need to make for a baseline. Personally, it always reads as lower than my oral temperature by about a degree.

I’d love to hear if others have tried this device or if you have thoughts on the difference in the oral temperature reading and core temperature reading with this device.

1 Like

@azure wrote a post some time ago that included details on tracking body temperature with iButtons: https://quantifiedself.com/blog/hot-stuff-body-temperature-tracking-ovulatory-cycles/

2 Likes

Could be interesting to try to establish how closely my skin and oral temperature correlate, and if I can use former to calculate latter (as @ssol mentions doing)… But initially I’m not even sure if the oral temperature measurements are sensitive enough!

I placed an order for a Kinsa QuickCare last month, and supposedly it shipped today…

I have since received the Kinsa QuickCare; here are some initial impressions:

  • Taking oral readings is quick and simple. No issues syncing the readings to the app (either at the time of the reading, or later).
  • Successive readings are within 0.1°C of each other, so there’s no point averaging out multiple readings. I have to assume the device isn’t cheating :smile:
  • You can export data for the last 14 days. The format is just about parseable.
1 Like

Kinsa recommends waiting 15 minutes after eating or drinking before taking oral readings. To see for myself if that’s really necessary (or, sufficient), I took my temperature a few times after drinking hot tea, and after drinking ice water.
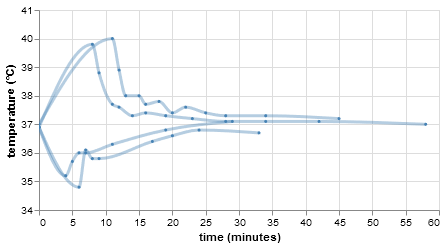
visualization

Looks like 15 minutes is good advice, but it can take up to an hour for everything to return to normal. Since I didn’t spit out my drinks, it’s possible that the changes that persist past the 15-minute mark do in fact reflect changes to my core temperature, rather than being measurement artifacts.

2 Likes

The Kinsa QuickCare Smart Digital Thermometer seems to be sold out widely.

Looks like their online shop has it in stock, at the moment…

Here are ~hourly temperature readings taken over a week (incl the median values):

visualization

This is about as expected, with lower temperatures in the morning, and higher temperatures later in the day. Much of the variance throughout the day can be explained by unsurprising things like meals, or sitting in a hot apartment… Exercise, surprisingly, appears to lower my temperature (or just the oral readings?), both indoor and outdoor.

I’ll continue to take daily readings in the morning, right after getting up. These readings have so far all been within the margin of error for the device. There isn’t an obvious (and convenient) time to capture the “high point”, which could have been interesting as well.

2 Likes

Here are my daily morning temperature readings (incl deviation from the 7-day median) so far:

visualization

The 3 readings below 36.7°C all happened to be taken after sleeping outdoors. The one slightly elevated reading so far (37.1°C) didn’t correspond to anything.

Could this be due to the thermometer being colder? To rule that out, I took a few readings before and after leaving the thermometer in the freezer for a few minutes:

freezer

Looks like a cold thermometer can indeed reduce the readings by 0.1-0.3°C! So if the air temperature is well below room temperature, I should probably warm up the thermometer in my mouth for a minute or two, until I get stable readings.

1 Like

Spent another night sleeping outdoors, with the air temperature dropping to around 14°C. But no matter how much I tried to warm up the thermometer this time, readings showed a consistent 36.7°C (i.e. 0.2°C below my normal)…

1 Like

Just came across this fun review of the Withings Thermo, looks like it isn’t suitable for detecting “normal” temperature variations:

Do you think your body is just colder?

Looks like that’s the case; just wanted to rule out that the lower readings are an artefact!

Next question is whether my body is colder because I spent time in a colder environment, or because I consume fewer calories while outside…

Perhaps not surprising, but traveling across time zones affects the morning readings: -0.2°C for a full week after shifting -9h, and +0.1C above my pre-travel temperature average for almost a week after shifting back.

Please help me graph the logic and interactions of all elements in this thread by mentioning mistakes. I have writen the relations like an outline / tree structure to see this particular subgraph easily. In the graph all items connect to their subdivisions and point to them. The exception is actual products which point in reverse.

temperature
	environment temperature
	core temperature
	peripheral temperature
	skin temperature
		core temperature
		
vaginal temperature
  continous 
	kindara
		priya unreleased
body temperature, core temperature, oral temperature
	kinsa
		export to file
		QuickCare 30
		Smart Ear 40
	Vicks SmartTemp 30
		export to file
  continous
	Raiing 
		export to ggl apl
		iThermonitor unreleased
		Fridababy,FeverFrida 60 FDA
	mbient labs 100
		export to file
skin temperature  https://en.wikipedia.org/wiki/Skin_temperature
	withings thermo 100
		export to withings
peripheral temperature, finger temperature
  continous
	oura 300
environment temperature
  continous 
	mbient labs 100
		export to file

Kinsa does non-continuous (note the spelling :nerd:) readings of oral, armpit and rectal temperature, which all reflect core temperature to some extent (the gold standard for core temperature appears to be blood temperature). So, looks fine to me?

raiing vicks and kinsa all hav eapps that export to something like csv? or do some of them export directly? Or do some of them export through gglf and aplh?