I posted a detailed write-up (incl source code) here.
5 Likes
Nice job! Any chance you could add error bars to the chart so the high/low variability in repeat readings can be seen?
As you mentioned, perhaps doing similar readings at other times of the day (afternoon, a few hours prior to bed, etc.) may give more insight into the variability of your blood pressure throughout the day and ultimately which time is ideal to track long-term (morning vs. evening)?
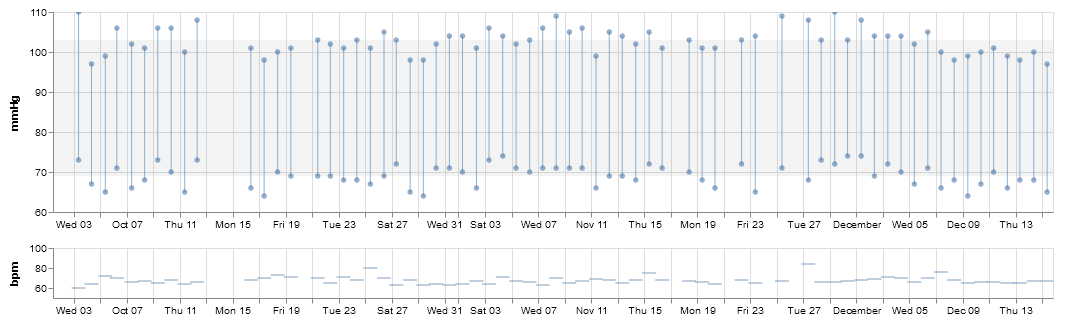
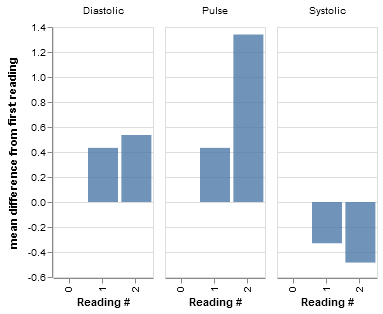
Repeat readings were usually within a few points of each other. The second and third blood pressure readings tended to be closer, so in future I might just skip doing the first reading 
I only took readings throughout the day once, it’s tedious! The highest (but not by much) readings were around 5pm and 8pm, as expected. Like with other measurements, mornings seem better for long-term tracking since the confounding variables pile up during the day.

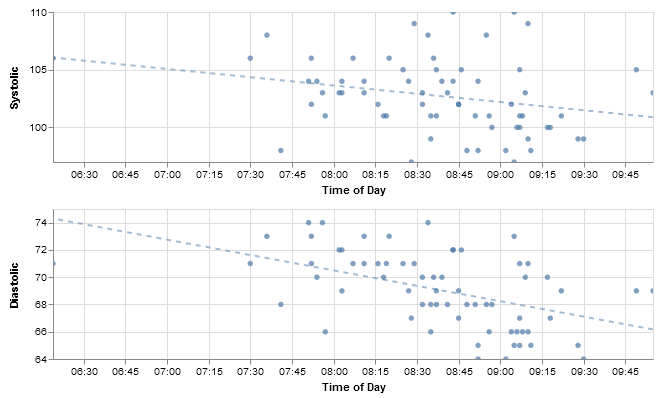
The only complication is that my blood pressure pressure appears to decrease slightly throughout the morning (~1.4/2.3 mmHg per hour), but this shouldn’t be an issue as long as I avoid very early or late measurements.
3 Likes
Interesting to see your graphs. 
I have also been tracking my Blood Pressure and looking for any association with insomnia and caffeine intake.  I am also working on my master thesis, I’m working on the design of a collaborative care workflow that can include self tracked data to prevent cardiovascular diseases and mentioning the Quantified Self as a community that has been pioneering self-tracking.
May I ask you which device have you used to measure your blood pressure and why have you chosen this one?
I used a Greater Goods blood pressure monitor, as it seemed to be rated better on accuracy than some of the fancier ones (like the Withings), and it lets you export the readings via an app, so you don’t need to enter all the data by hand
2 Likes
@ejain What accuracy ratings are you referring to? I find myself pretty concerned about blood pressure reading accuracy, having seen both drift in my own devices and disagreement between devices. Maybe time to do a comparison post.
Just random user reviews. Could be that the fancier devices have more user error
The monitor I ended up getting appears to be precise enough (see the repeat readings chart above) to be able to see changes caused by different postures or other factors, and accurate enough to match readings taken at the same time at the doctor’s office.
So it’s accuracy that drove me to a manual cuff. My experiences between doctors that use machines, friends and family that have them, and manual reads from my doc and myself suggest that manual is very regular between reads varies very little from then and my own reads.
Once mastered manual bp is quite easy to do, and avoids, more often than not, scary high measurements, which according to reviews, is how most, even expensive units, will fail.
Besides choosing the device it is very important to pay attention to your body posture during the measurement.
Maybe you have already seen this, but, anyway, I find these guidelines helpful for this. Of course you may want to measure BP under different circumstances, but that’s useful for having a baseline.
1 Like
In one of his recent videos, Michael Lustgarten mentioned how body weight is strongly correlated with blood pressure.
Since I now have 4 years of monthly blood pressure readings, and daily body weight (and composition) measurements going back even further, I figured I’d check for myself…
Surprisingly, my systolic blood pressure appears to be inversely correlated with my weight (and % fat):
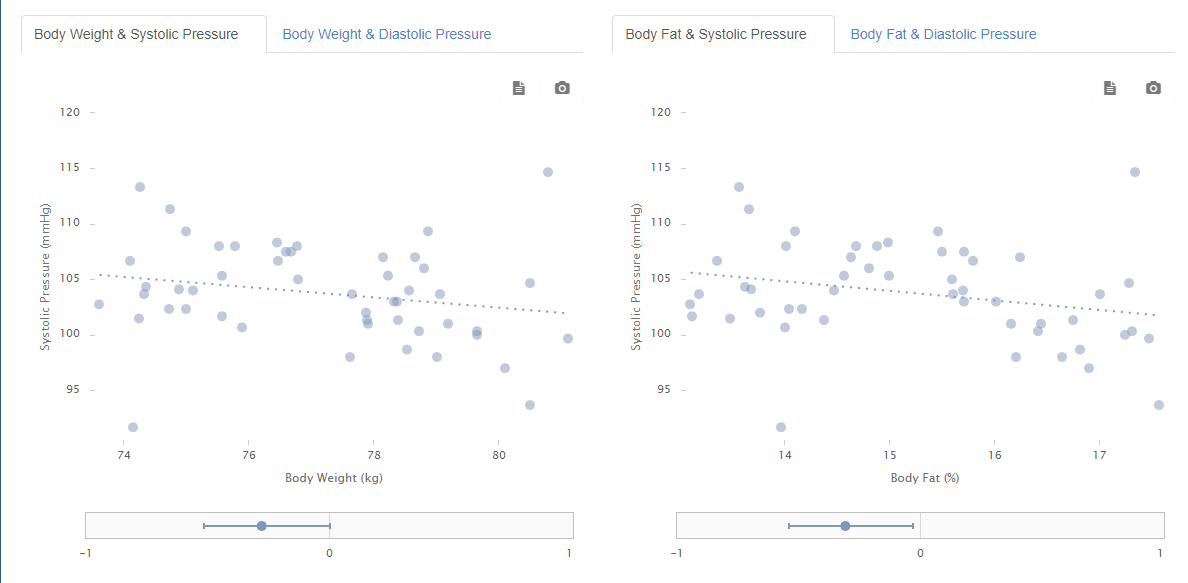
This is even more so for the diastolic blood pressure:
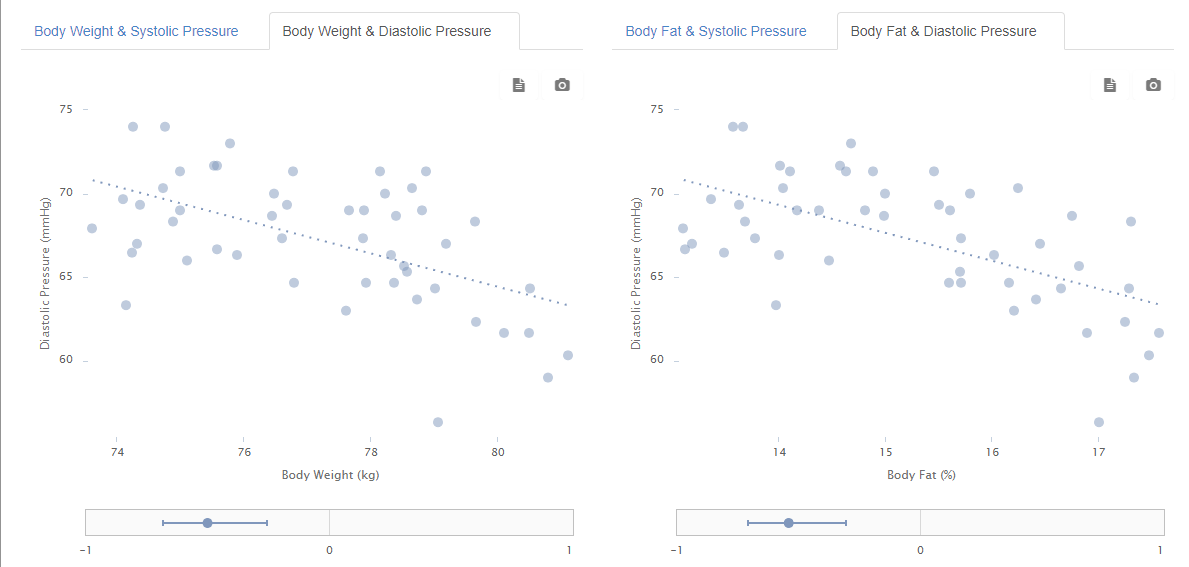
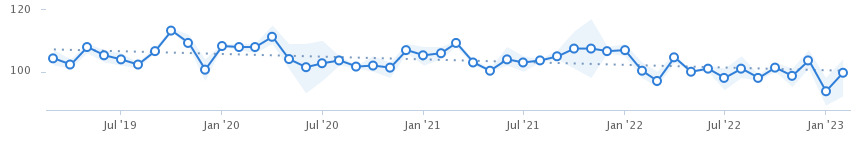
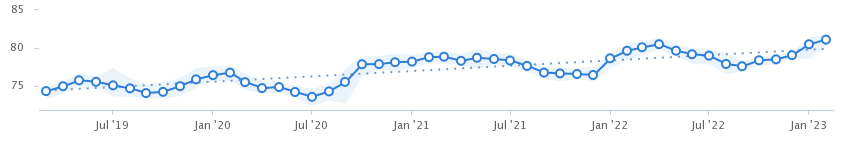
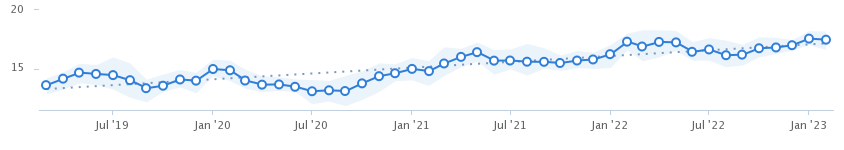
Overall, my blood pressure has remained stable over the years, whereas body weight has increased slightly (with some ups and downs), so these correlations aren’t likely due to any long-term trends.
Probably best if I don’t draw any actionable insights from these correlations ![]()
1 Like
Could you show us graphs of all these variables over time?
Could you remove the linear trend from them and then try correlation again?
After detrending the data, there isn’t much of a correlation left (r=0.07 for systolic-vs-weight and r=-0.08 for systolic-vs-fat). So we can’t blame temporary ups and downs for these counter-intuitive correlations ![]()
1 Like
Possible explanation for the downwards trend (suggested at this morning’s Open Humans Community Chat): The fabric or rubber band on my blood pressure monitor is gradually wearing out… Guess I’ll find when the device dies and I have buy a new one!
Just had a physical exam, and the (manual) blood pressure reading was 108 over 84. I brought along my blood pressure monitor, and that gave me 114 over 74: So it seems unlikely that the systolic readings from my monitor are too low.