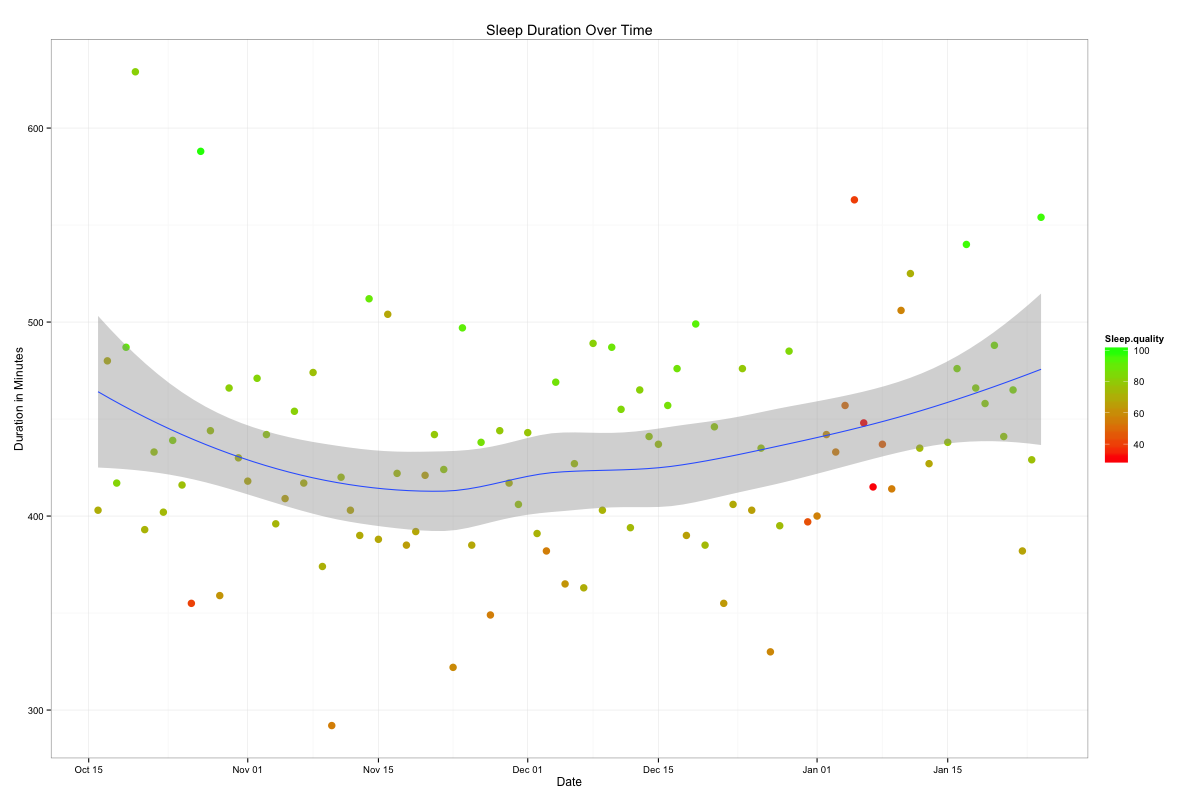
I took a look into my sleep using the Sleep Cycle App for the iPhone. After exporting the data I used R to generate some charts:
A write up and the code can be found at my blog
I took a look into my sleep using the Sleep Cycle App for the iPhone. After exporting the data I used R to generate some charts:
A write up and the code can be found at my blog
Hi Tafka,
I like your charts you posted recently. I think I have to get familiar with that R. My data doesn’t look that well.
Thumbs up for your work.
What I like about using R is the reproducibility. Once you have written your scripts you can just swap the input file for a newer version and recreate the charts with just one click. Once I have more data points I will present and updated version of the chart.
Since you’ve already made the charts public, any chance you’d make the spreadsheet available, too?
Hi Tafkas, good stuff. How is “sleep quality” defined? Thanks!
Could you give me a link to the program? “R”? Thanks a lot, I couldn’t find anything via the searchfunction “program R”
R can be downloaded at http://www.r-project.org
You might as well check https://www.rstudio.com which is powerful and productive user interface for R.
The package used to generate the plots is ggplot2.
http://ggplot2.org
Hi Tafkas,
I like the charts.
I tried the Sleep Cycle App and was disappointed with the results. I positioned the unit at the head of my bed and calibrated IAW instructions. I use a Zeo bedside for a baseline. The Sleep Cycle app was unable to detect that I was awake, but not moving around. I think the Beddit unit may be better for non-contact sleep measurements.
I also looked at your HRV data on your blog. I just got a full nights data set using a Polar H7 with soft strap and HRV Logger app. I only had one "bad " data point in a 7 hour sleep (I figured out how to keep the strap from disconnecting when I sleep on my side).
Thank you