I have been using Anki SRS flashcard tool for 3 years to learn Spanish and some technical terms. Lots of data was accumulated which I am now analyzing:
GitHub - ran88dom99/Flashcards-as-Cognitive-Test: In depth analysis of the data Anki records for, possibly, cognitive testing. Also teaches users about learning and allows them to experiment with and optimize their own learning process. Encourages via gamification too.
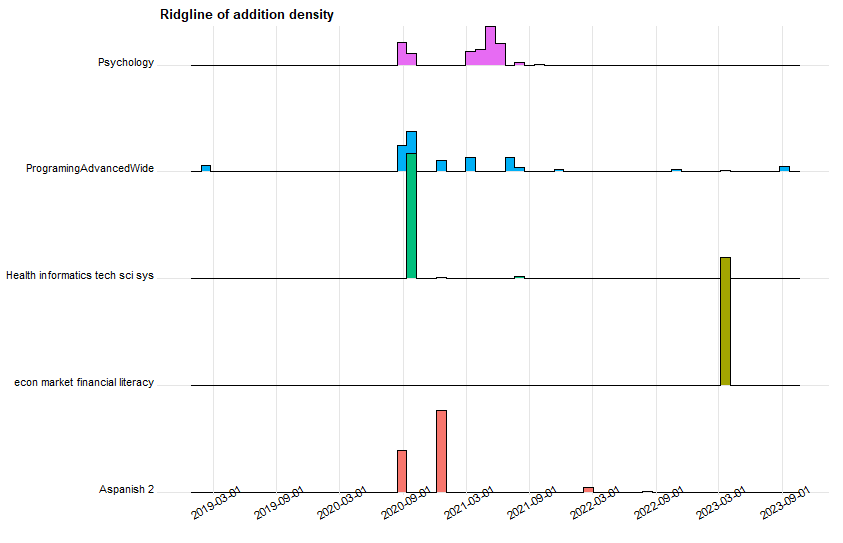
Heights based on percent of cards added that period. Separate histograms for each subject. I just think its pretty.
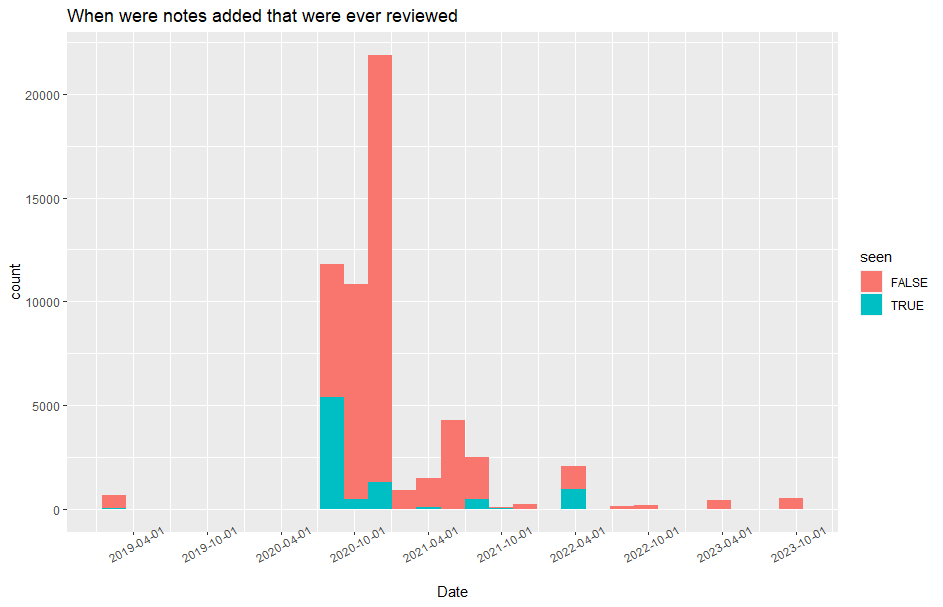
Following plot shows that I got overenthusiastic in adding new decks and have yet to review most of them. Also the overenthusiasm happened after good additions and then faded.
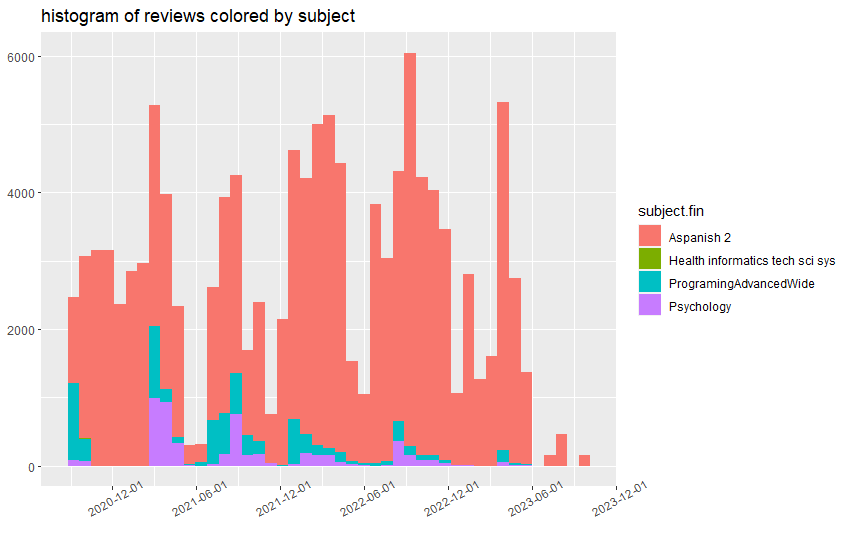
Histogram of reviews (answering a card), colored by subject. Shows I have had some slack periods of which the biggest is happening right now. Studying of subjects other than Spanish has been decreasing pretty much from the start. This probably just means I have learned the material I started.
1 Like
Following is a link to see step 2 without downloading anything: RPubs - Anki_to_cog_2_Subjects
Though people upvote this project no one uses it. I plan to mothball it until someone else gives me their data or runs the script on their own data and shows me the output. Please give me your collection.anki2 file !
I like to dive into new datasets by making many scatterplots automatically. Most of the plots are pointless and most of the remaining plots are hard to interpret so they are not for end user. Still this technique is good for brainstorming, diving into a dataset, data validation, and checking for dependencies missed by ML algorithms. All plots in this post were generated this way.
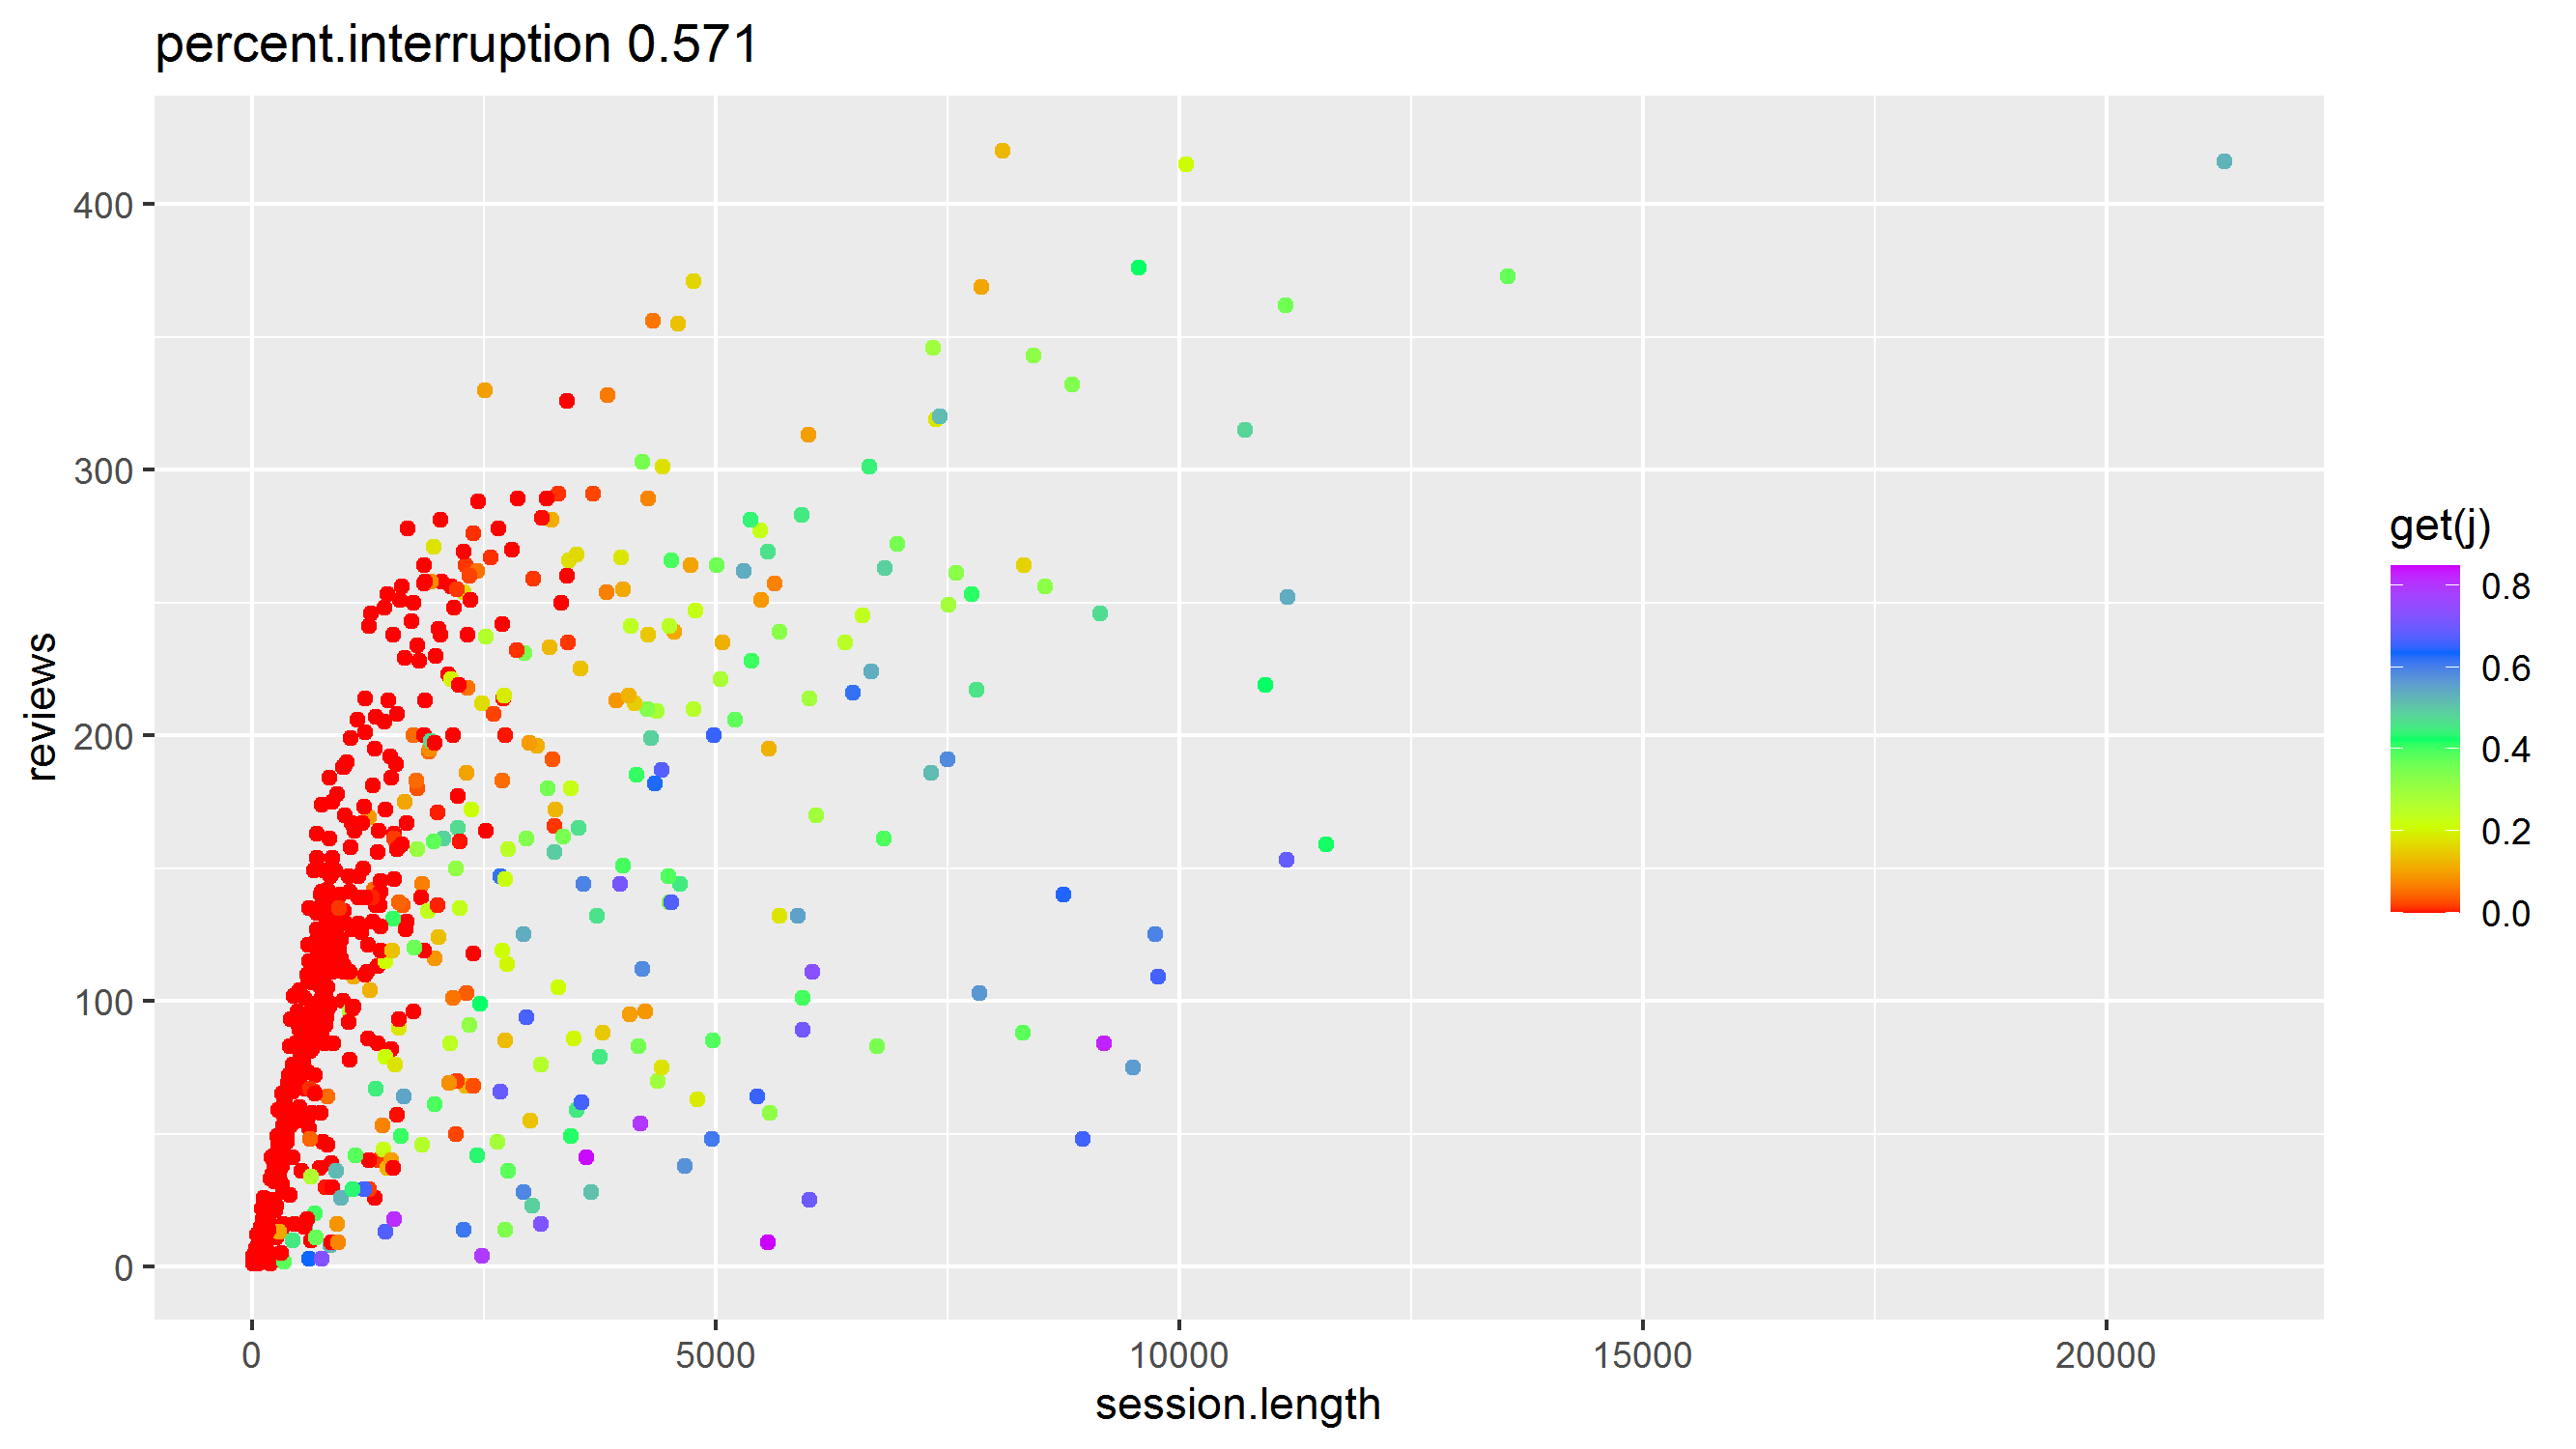
Session length (x axis) is composed of number of reviews (y axis) times average time taken for each review plus time spent interrupted (color). This plot of three mathematically related variables shows what I mean by relationships that are expected artifacts of generative process. This plot is useful for debugging and data validation but does not show any new patterns.
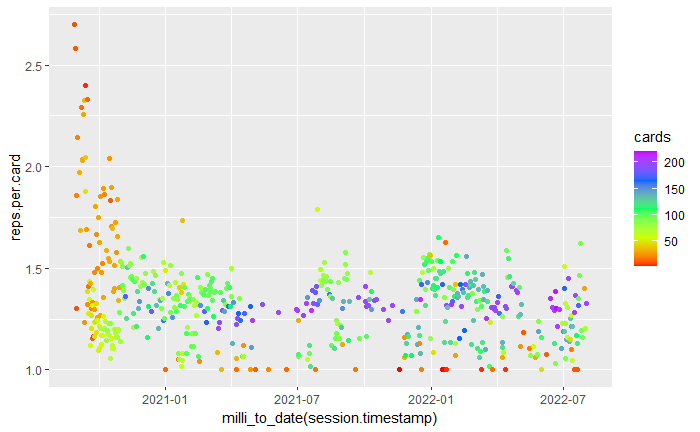
Above is a scatterplot made using only the cards of a foreign language deck. Average number of repetitions per card is on y axis and the date is on x axis. Points are colored by number of cards reviewed in that session.
Plot shows lots of expected patterns. In the early sessions I was just learning cards and not reviewing many so there were many repetitions. (lots of red dots at top left) Sessions with more cards reviewed in them tend to spread less along the y axis (average repetitions per card). In the plot this shows up as blue dots being closer together than green dots. This needs to be analyzed. There were some good (esp around 4-2021) and awful sessions and periods of lax discipline.
Unexpectedly, there is a strong change point in the generative process where the first blue dot appears and sessions with high repetition and few cards stop. This is because before that point I did two sessions per day with only cards still being learned (rather than reviewed) in second session. Also, I probably occasionally review small number of cards and then stop when the going gets tough (red dots at bottom). Therefore scheduling and my personal determination changes the distribution of the difficulty of cards reviewed in a session. Just using the average repetitions per session without adjusting for difficulty of cards is only vaguely related to performance and current cognitive ability.
I think main issue with using Anki as cognitive assessment test is that each test is different, thus hard to compare tests between themselves. Because you see mix of cards, each card is gradually learned over time and different cards at different progress level.
There are other factors which affects results and hard to measure (some words may be easy to memorize and some not)
So i see problem with internal validity in that kind of test.
Another thing is to understand how to interpret the results, usually there are some studies which have found some relations between cognitive test and some brain states. Like Stroop test which assess working memory.

As this example of a terrible learning illustrates, cards have states. Ex. being learned successfully or extremely uncertain or even constantly forgotten. This is what is most important in learning. Too many changes between states in one session would imply a better than average or worse day. Often I forget a card and almost intermediately relearn it. (4th vertical section) Tip of the tung phenomenon. Even if there were days that had lots of those they would not be very terrible for learning. Difficulty in learning new cards may matter more.
Same solution to both problems; Try to predict outcome of each individual review of a card by running statistical inference algorithm (random forest) over all the variables that would interfere with the test therefor removing them to some degree. And then using the residual as the test.
stroop asses executive function
https://wiki.openhumans.org/wiki/Flash_Cards_as_Cognitive_Test
So main would probably be just Long Term Memory but the closest scientific
validated tests are like at most a day from moment of learning and there are very few papers on continuous longitudinal studies involving memory.
1 Like