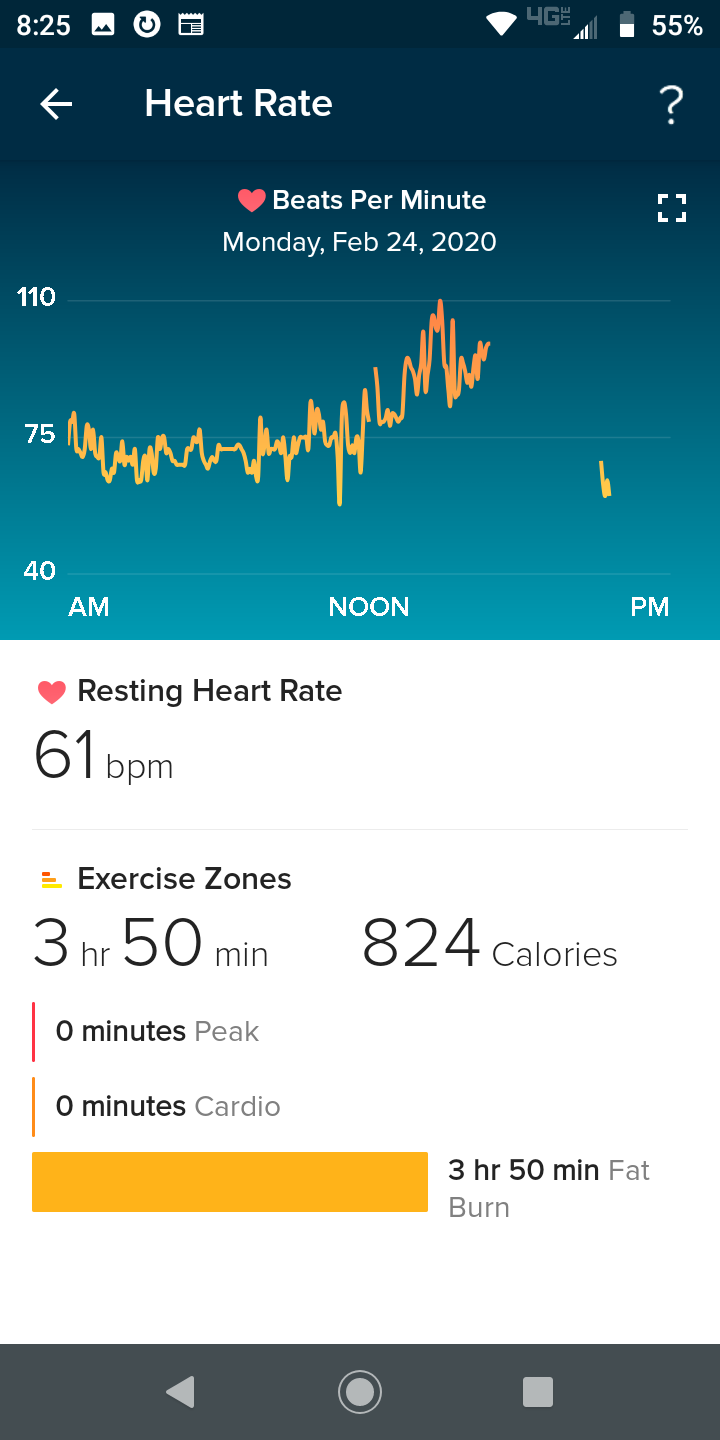
So I am planning to finally get a COVID antibody test. I was pretty sick all during March and had a peak temp of 101F at the start of my illness.
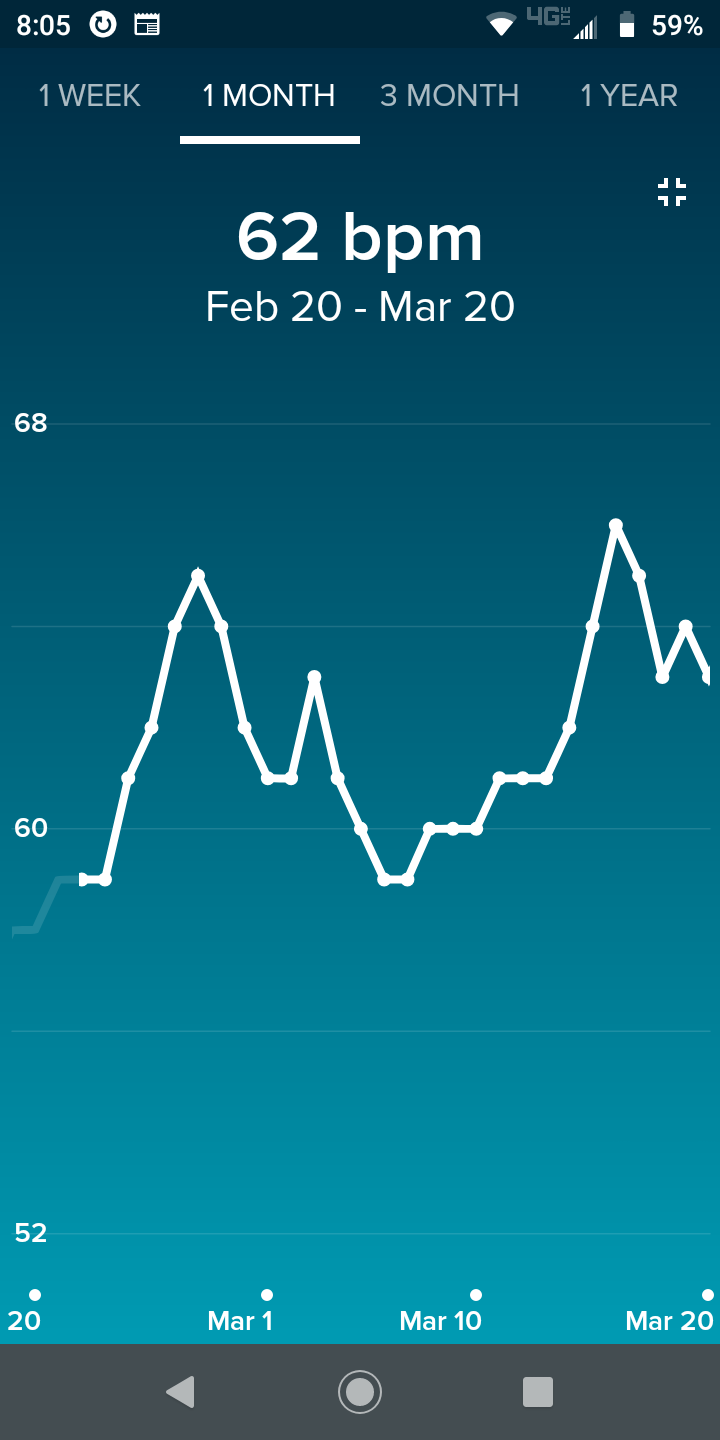
I have been much more careful about my diet since then and today noticed that my daily RHR has not gone over 61bpm since March 31st. At the peak of my illness my RHR was 65bpm plus I had a secondary infection a couple weeks later and another spike in RHR.
Fortunately, my RHR rate has been much flatter in the past couple months. The other thing I realized to is that Fitbits aggregate Monthly and Year graphs seem pretty useless since they tend to filter out short term acute infections of a week or so. I get a better picture when I scroll through a graph of my daily RHR data.
I also noted that I haven’t since had a slow quadratic rise in pulse over several hours on the day I first had my fever onset. It was bad science, but my pulse elevation scared me so much then that I took off Fitbit for about a day to lower my anxiety.
.