[quote=“Robert_Ness, post:5, topic:671”]
I have a couple of the op-innovations devices and I’ve done some tinkering. I managed to import the data into R. [/quote]
AWESOME! 
[quote=“Robert_Ness, post:5, topic:671”]
So far I’ve been focusing on the accelerometer data, only recently have I tried working with the EEG data. I expect that I’ll do some kind of transformation of the data into some ratio of high and low frequency bands, though haven’t yet figured out how or if its even feasible with this device. [/quote]
If you send me an email, I’ll hook you up with a good resource how to do this in Matlab really quickly via dropbox. (It’s probably similar for R, once you have the code.) my full name with a dot in the middle at gmail dot com
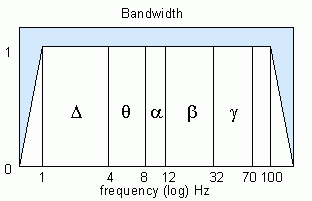
What you’d normally do is take a recording and do a fourier tranformation. Then you pick a range of frequencies (eg. 8-10 Hz) and calculate the average bandpower in that range. You arrive at a single value for each band that you look at. This is something you could be tracking. This is a graphic that shows where to find the different frequency bands in the spectrum:
Then you can also look for peaks in your fourier transformed data! The alpha, beta etc frequency bands were defined because you can observe distinct peaks in the oscillatory activity in these ranges. Look at the distinct peaks in the following depiction of an averaged spectrogram:
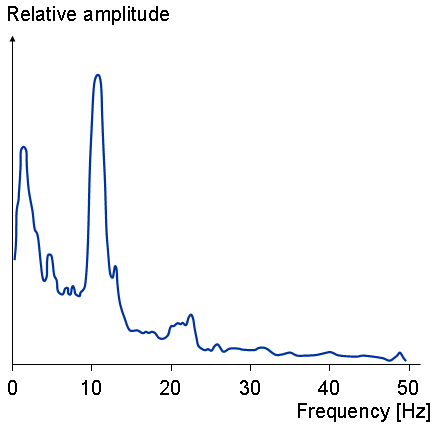
These local maxima vary. For example, if you’re getting tired or if you’re suffering from burn-out, you’ll find a lower peak in the beta range. You can find these maxima in your frequency plot and track them, too.
As for recording the data: try to have a fixed task that you’re doing while recording, and different tasks can have very diffent responses, and movement makes a lot of difference.
For example measure every day on your way to work or implement a meditation routine into your day and measure while meditating. (Although the latter wound of course introduce meditation exercise effect as a confounder into your data.)
It might also be important to find some subjective measure of how well you can focus, using a mobile app or a pocket diary (pocketmod.com)
You could also use a battery of tasks on quantified-mind.com WHILE you’re measuring. (Mind that you can set markers with the op-innovations device to signal on and offset of tasks.) If you ask the people who run the site, they will be happy to help you to conduct an experiment and put together the tests you need for you.
Me too! Note however, that the op-innovations device uses reusable gel-patches for EEG recordings.
http://op-innovations.com/en/gelpad
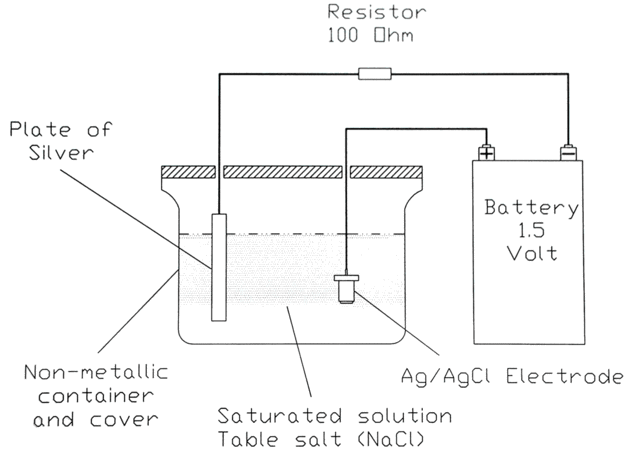
Ingenious if you ask me. The only thing you might add to the silver plated electrodes is an AgCl coating. (btw that’s easily done with clean silver(-plated) electrodes, some salt water and a 9V battery, I’ve done it before, works like a charm!)
please, please, test this! I’ve been suspecting this for years, now that there’s someone with some R knowledge, this must be tested! My bet is definitly on total entropy!