I’ve been messing with the QS app to extract data. Still some data that I cannot get to (Heartrate variability, sub-minute timestamps, heartrate category) but this is starting really well.
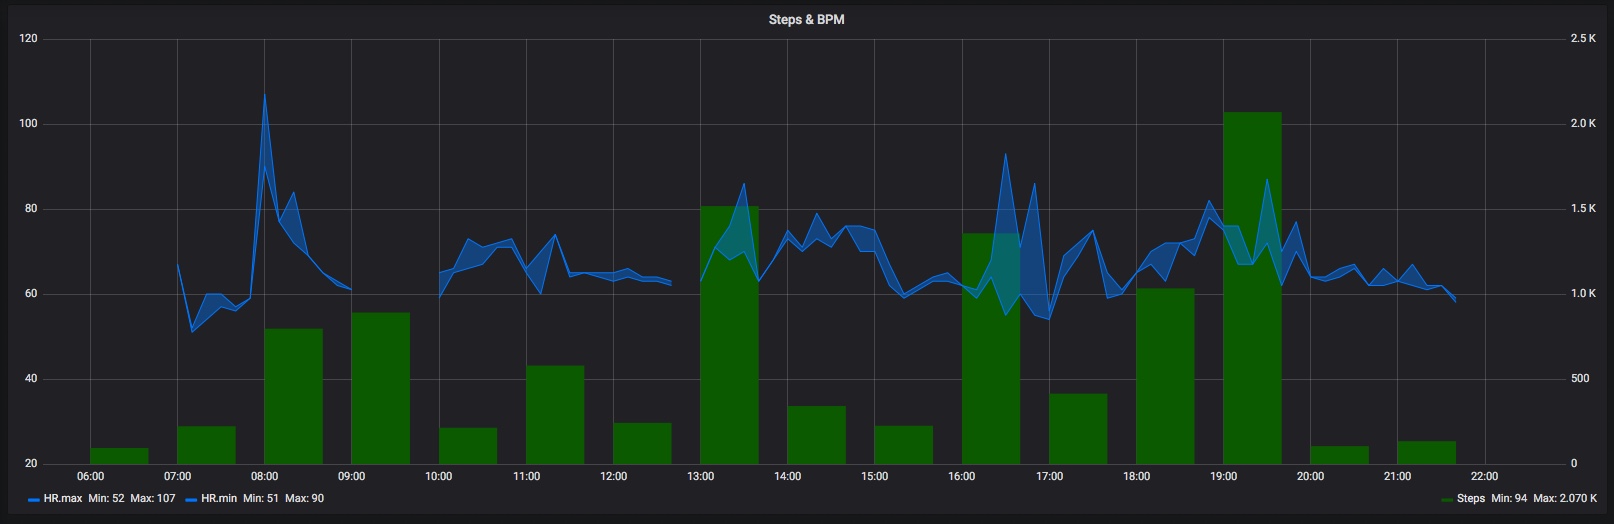
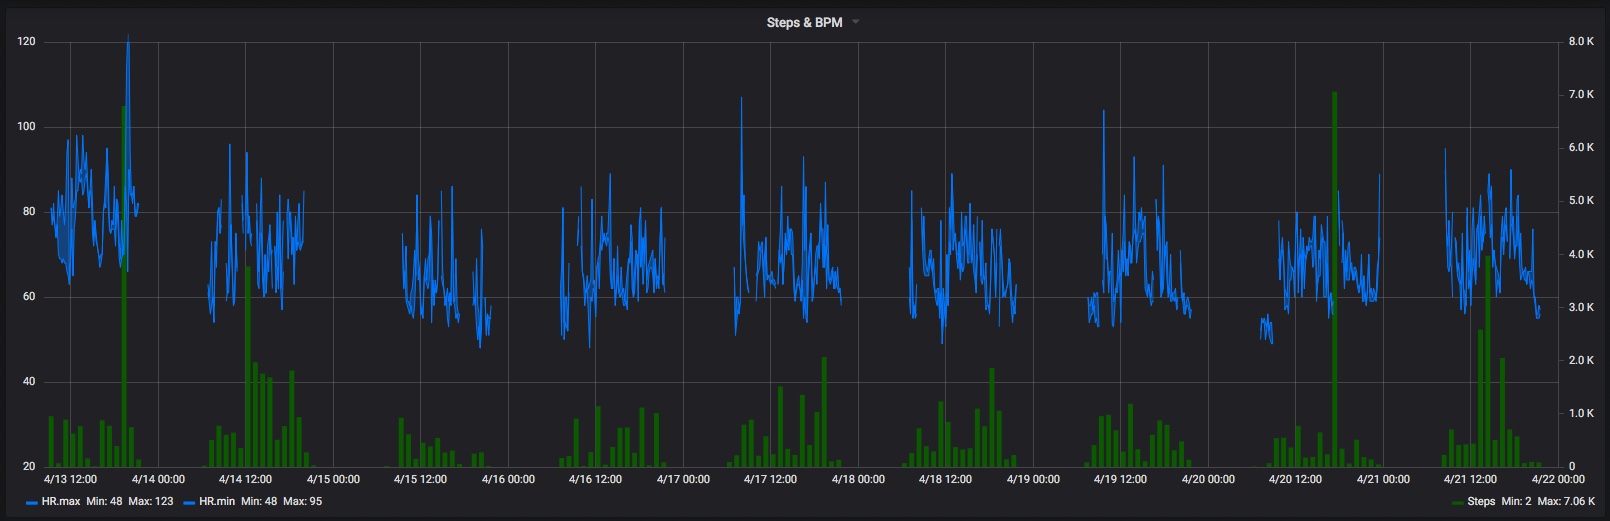
I export the data from QS, use a simple Python script (github) to insert into InfluxDB, and Grafana to graph it. Below shows several days, and zoomed into one day.