Healthy HRV values and patterns

Wouldn’t know how to measure respiration rate to be honest. Wouldnt that be linked to HRV in a way that it can be meaningful to measure either? (with stress respiration goes up, HRV down… for instance?)

As for blood pressure; what kind of changes are we looking for here? I find mine to be quite stable and therefor tend to not measure it often (or at all…)… or is a deviation from 120/80 to lets say 124/83 meaningful to measure?

By the way; big problem with blood pressure is you can’t really measure it without being quite invasive… you are aware it’s being measured, while you forget the HR monitor. Wouldn’t this influence this quite a bit as well?

Influence of awareness on blood pressure is significant, but in my experience it has a “floor” at a certain minimum mm Hg. In other words, you can raise your blood pressure a lot by thinking about it, especially concentrating on frightening thoughts and memories of strong emotions, but you cannot lower it below a certain boundary by your momentary awareness. (This is probably true at the upper bound as well, but as I’m trying to lower my blood pressure I haven’t experimented much with raising it.)

During exercise, your BP (and respiration rate) might change a lot (depending on the exercise). But these are just extra outcome variables for your study. Not something that you want to control for.

Thus, I don’t understand why you want to add respiration rate and blood pressure as measures. He wants to look at HRV as outcome variable right? Or is there some way to calculate BRS based on HRV, RR, and BP?

Thanks!

Interesting observation: I’ve been ill (with fever) for the past 2 nights/days and as expected this is reflected in the HRV and HR markers;
morning HRV went from a baseline of 6.9 down to 6 and 5.8.
Average sleep HR went from the 60/70 range to 91. Interesting to see that the average HR the first night was not significant higher, which matches the fact that the fever only came later during that day. So the morning HRV was a ‘predictor’ in that sense that it reflected something wrong earlier. (must say I also did quite intensive exersice the day before)
the average rMSSD during sleep went down to 15.2 this morning, but still was 35 yesterday (and 56.6 the day before, to put it in perspective).
However, rMSSD is fluctuating quite a bit per night, so that’s still not a reliable indicator of anything at this moment.

Last additional note; I’m coughing heavily, which of course is also influencing heart rate :slight_smile:

edit/update: HRV was 5.6 this morning which is interesting as this is moving even lower, while average HR is getting down again as fever seems to be less and slowly feeling better.

This article is going to be in our “What We’re Reading” newsletter this week, but I thought I’d link it here. The bits about HR and illness are especially interesting:

Tracking Physiomes and Activity Using Wearable Biosensors Reveals Useful Health-Related Information

(You can sign up for What We’re Reading if you want it by email. The frequency is “whenever we feel like it.”)

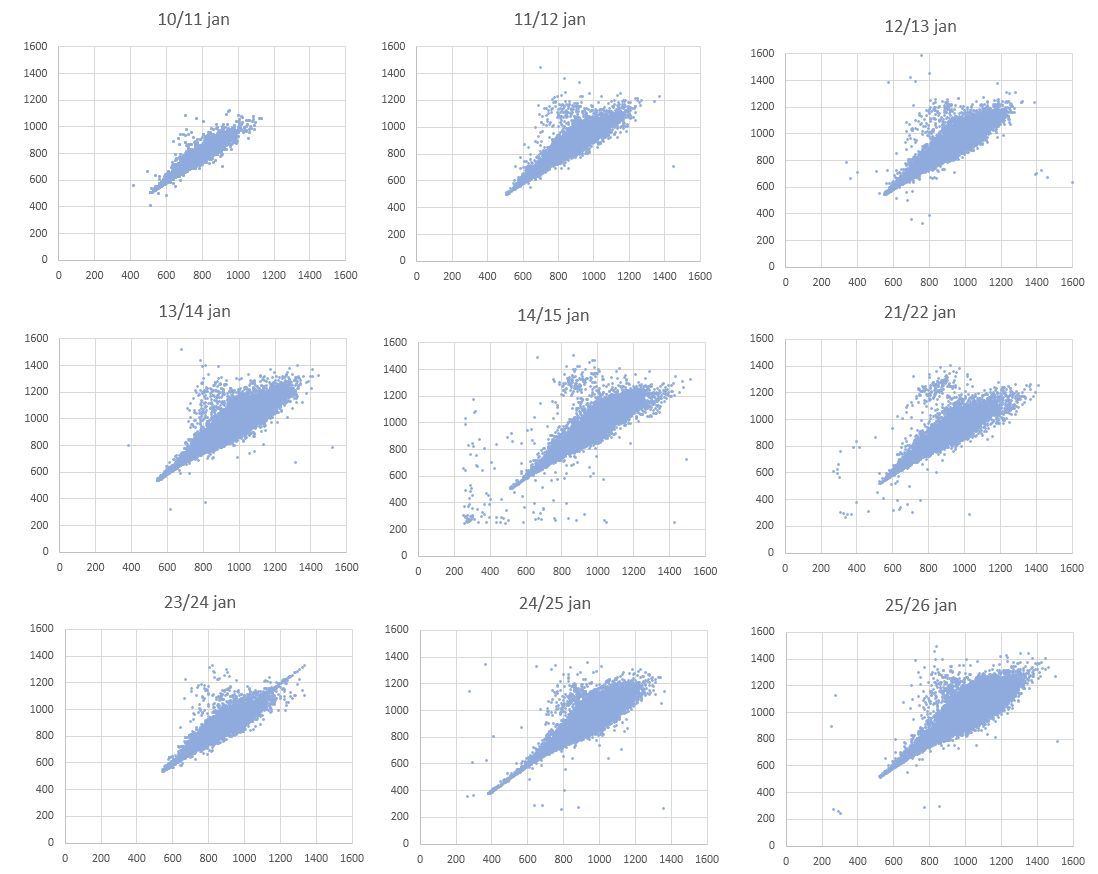
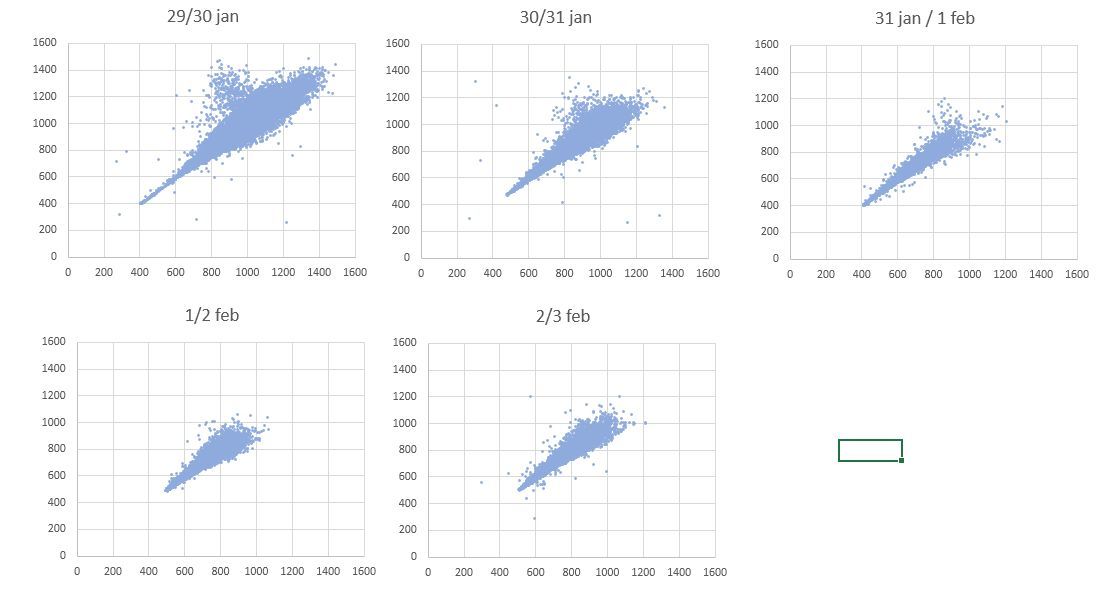
Those plots look to me like what you want a plot to look like, a long shape, that means your heart beats are nice and variable. That makes sense if you were tracking all night. The time you measure affects HRV because your position and activity and metabolism will alter the beats, so you want to compare same tracking time to same tracking time. Like 2 minutes to 2 minutes or 5 minutes to 5 minutes, or 24 hours to 24 hours.

The shorter that oval in the poincare plot is the less range between the longest and shortest beat intervals. Plots like this can be used to determine if you have unusual beats or the equipment isn’t working. Then you’ll get more outliers. I don’t know what that flying saucer shape on the right means, but I don’t think you have too many outliers to suggest skipped beats.

I took a PhD level class on HRV biofeedback (HRVB), which is when you use lab equipment or cheaper software like stress eraser or heartmath or even a breath pacer to make your HRV go up. It goes up anytime you breath at around 6 breaths per minute (10 seconds per breath) because of a resonance frequency with blood pressure. That is why heart math is pre-programmed to use that breathing speed although you can change it. Adult people have similar enough blood volume that somewhere between 4-7 breaths per minute is always going to create coherence. It really has very little to do with the emotional part and breathing through the heart, its a straight up biohack.

For everyone the heart speeds up when you breathe in and slows down when you breathe out, but when you breathe at a certain pace which syncs with the momentum of the blood in your veins and the time delay (5 seconds) in the stretch receptor mechanismsin the cartoid artery, it creates greater HRV thus higher values for stats like RMSSD and PNN50, SDNN etc.

Academics consider the simplistic interpretation of parasympathetic and sympathetic control relating to LF and HF HRV outdated. There evidence that the parasympathetic nervous system can affect both values.

Also that interpetation only holds for a certain rate of breathing. The rate of breathing will vastly affect your HF/LF ratio and if it is slower than the normal person (normal is around 15 breaths per minute, slow would be like 8 or 10). it will make you look way sympathetic dominant according to those simplistic interpretations. Unfortunately it is hard to track your breaths because you automatically breathe slower when you count. There may be a motion sensor app you can put on your chest when you are reading or something so you forget or you can have a friend or girlfriend spy on you.

So Altini recommends taking your HRV each morning at the same rate of breathing. Though this ignores the possibility that slower or faster breathing is related to health. There is some evidence that those with PTSD slowed their resting breathing rate, improved their resting HRV, and improved their symptoms all at once as a result of HRV biofeedback.

Anyway hundreds of studies for HRVB show improvements in resting HRV stats AND most importantly improvement in whatever clinical condition was being measured (anxiety, depression, pain, heart disease, asthma, etc), after practicing resonant breathing for awhile, say 4-6 weeks, 10-20 minutes 1-2x a day 5-7 times a week. It isn’t known though how long these changes might last if you stop the practice. It isn’t known by what pathway it helps, possibly something with toning and exercising the vagus nerve. Sometimes, even often, the clinical improvements happen without improvement in resting HRV over time.

All this said I do not have a paper with the average healthy or optimal values you are looking for. I asked the same question and my professor told me rather rudely that it was in our literature, but didn’t tell me where. So all I have are research papers with the resting values of various populations studied from shortish measurements 2-10 minutes. I can upload articles here if you are interested in anything in particular.

2 Likes

Also, what health problems are you working on, Christian? Maybe there is something we can collaborate on figuring out. I have fatigue, muscle pain, anxiety, depression, food allergies, and a chronic burping/stomach gas thing with some bloating, but not much in the way of IBS.

Hi. What is the name of the professor? I would love to see the articles. This is extremely interesting. There is book CNS unraveled which goes through a lot of these issues. Marc

great info, thanks!
I’m still a bit confused though whether you claim the HRV improvement by breathing more slowly is just a hack to get the number down without doing much else, or if this can indeed be a way to improve certain clinical problems? (you seem to state both ;))

not much overlap in health problems I’m afraid;
the fatigue is there, but other than that I’ve chronic headache (daily) and migraine (weekly), painfull spots in my muscles (feels like I’m bruised), tinnitus and sensitiviy to sound and light

The heart ‘problems’ I’m seeing is/was a high resting HR, which went down now I stopped my medication against the headaches. But besides that I’m seeing weird fluctuations in HR during certain specific activity between different days. HR can differ by 30 beats easily for the same effort (easy cycling on a given resistance and speed in fitness center).
Besides that I have some weird ‘dips’ in HR from time to time during activity where HR will drop 10 to 20 beats while maintaining activity. I can’t associate these things with any specific feeling I notice when this happens.
Lastly I have huge dips in HR when I go from standing to sitting while HR is high. At one time it went from 180 all the way down to 100, and it will stay at this low point as long as I’m seated, and went back up to 180 when I stood up again. The dips seem to have diminished in intensity after I stopped medication, but still is around 30 to 40 beats.

Now I think of it, would be quite interesting if some of you could test this out whether you see the same thing and to what extend? :slight_smile:

Some more Poincare plots to explore/demonstrate what they can tell about what’s going on;

good to note that I stopped taking Amitryptiline the 19th

There seems to be a thin longer tail present at the bottom end that wasn’t there that distinct before I quite the medication

Next the influence of fever/being ill;


I developed the fever on the 31st during the day, eventhough I didn’t feel well already at night/in the morning. The plot supports this as it is already smaller (especially at the higher end).
The next nights show clearly a big difference. The interesting thing is though that the fever was gone the last night, and I had no ‘hot/cold episodes’ that night. The plot however is still far from normal and still quite similar to a fever night.

Professor Paul Lehrer. He’s old school. He knows nothing about biohacking and sports HRV. What interests you the most? review articles of clinical improvement in symptoms after hrvb for different diseases? specific diseases? basic articles about the resonance frequency and why that breathing rate works? sympathetic/parasympathetic controversy?

Hi Christian, I don’t know too much more about interpreting the poincaire plots. Some of those with more scatters do look like you could be having skipped beats (which throw the points all over because your interval will be about twice as fast or slow as normal) If the doctor didn’t see them, that could be because they aren’t always happening. Could be your equipment is just doing weird stuff. Could be I’m wrong. I mean if you can catch a graph throwing up dozens of points outside the main circle at rest you should be able to feel if your heart is doing strange stuff with your hand on your neck to confirm if the equipment is working.

Most types of traditional HRV analysis would simply erase all the outliers by hand and only look at the main cluster of beats to determine HRV, because those half and double beats always happen for some people due to genetic issues. You could argue that maybe they aren’t healthy then, but researchers tend to treat that as a separate issue from the type of healthiness indicated by HRV of normal beats. All the statistics are related to normal beat to normal beat intervals. And sometimes you have to tell the software what a normal beat is. I don’t know if Marco’s app throws out weird beats or not. I have supposed links I can email people to download the free Kubios Software from U of Finland that you can upload raw data into, and edit it by hand, and perhaps get different graphs that your app shows you but haven’t ever done it. On a regular ECG line also you should be able to see each beat and see if there is something abnormal going on. google “ecg ectopic beats”.

As for comparison. I don’t have a heart rate monitor right now, so I’m not sure it would be a good comparison if I don’t use the same app and monitor, but I might get into it again. I don’t wear bluetooth. When you are sensitive like I am the measurement device can affect your measurements because wireless is a universal stressor. I think for everyone, but for some people it really shows.

Sounds like we both have systemic breakdowns with inflammation and HPA axis problems. I have a low resting heart rate, in the 60’s lying down, and none of the HR weirdness you have that I am aware of. I have moderate sound and light sensitivity. I do have slight tinnitus, but it is life-long so I’m used to it. I did have daily headaches before refining my diet. I only get migraine type headaches on the rare occasion from dehydration/electrolyte imbalances. What have you tried so far for relieving them?

Someone else mentioned it already i think, have you looked into POTS much and if you qualify for that? Your hR has to go up more than say 20bpm and stay up for over ten minutes after standing. http://www.potsuk.org/gp_guide.

Do you ever have dizziness when standing suddenly? I have a little, especially if it is hotter outside, but it isn’t too bad. Last time I checked my bloodpressure stayed about the same upon rising. Which is good but not optimal. Optimal would be if it rose slightly at first. That has to do with aldosterone wasting in adrenal fatigue.

.

1 Like

I am working on trying to treat chronic pain and hypertension by improving the autonomic nervous system. We are using baroreceptor sensitivity as a biomarker to measure how well we are doing. Since BRS is the change in HR/Change in BP (using both the sequence method and spectral analysis) it is tied to BRS by the numerator. So hrvb for different diseases and the sympathetic/parasympathetic controversy or RSA impact. Thanks

Well, yes it is both. If you breathe at around 6 breaths per minute at any time, your HRV will typically go up while breathing. That will make the time domain numbers better/higher (RMSSD, SDNN etc).

However if you do it for awhile, say 10 minutes, because of the calming/stiumulating effect it has on your nervous system it probably will improve your performance both immediately, like if you take a test or give a speech as soon as you are done, and if you do it daily you have a much better chance of improving clinical symptoms of many different diseases over time. If you do the breathing daily your resting HRV (HRV when not paced breathing) may or may not improve irrespective of your symptomatic improvement. Studies are mixed on that.

Does that answer the question?

Frequency domain (LF/ HF) numbers will also be altered by paced breathing. If you breathe at a slower pace you will nearly always get high LF because you are breathing at a lower frequency, aka less breaths per minute. And breathing is one of the main determinates of HRV because of the respiratory sinus arrhythmia phenomenon: inhale heart speeds, exhale heart slows. The more it speeds and slows with each breath the better, hypothetically. You want a highly toned and responsive heart.

So LF under paced breathing or slow breathing for some other reason like poor metabolism and hypothyroidism could mimic something that looks like extreme sympathetic dominance if you interpret those frequency domain values as the athletes use them. So don’t look at it like that unless you are sure your breath rate compares to a person you are comparing yourself too.

LF =0.04 to 0.15 Hz,

if you breathe at a 6 breaths per minute, this is 6 breaths per 60 seconds, or one breath per 10 seconds, or .1 breath per one second or .1 Hz. So you are highly likely to generate a graph with oscillations of .1 Hz. And to see a spectral peak in the LF range. These ranges have nothing to do with any field other than HRV. LF for electricity is way different.

HF= 0.15 to 0.4 Hz

If you breathe at 15 breaths per minute, this is 2.5 breaths per 10 seconds. or .25 breaths per second, or .25 Hz. And as you see that is in the HF range. I may be mistaken but I think they defined the HF range using the typical person’s breathing rate and RSA. At rest, breathing normally, RSA shouldn’t contribute to LF oscillations of HR, but sometimes it does, is my point. So when you see a high HF/LF ratio means you are relaxed and parasympathetic dominant, it may not be accurate for that reason alone, among other reasons.

So slow paced breathing will make your frequency domain stats look “worse” while doing it.

Yeah, I should probably write a small e-book on HRV for biohackers or something because I know to much about this for someone who doesn’t even use it.

1 Like

ok, here is one about pain, one lit review, one about the controversy, one about baroreflex gain

Section 11 Restoration of vagal tone abdominal pai .pdf (216.4 KB)
Section 9 Wheat Biofeedback of heart rate variability.pdf (261.5 KB)
Section 5. LF as a measure of sympathetic tone.pdf (318.9 KB)
Section 9 Heart rate variability biofeedback increases baroreflex gain.pdf.pdf (479.6 KB)

1 Like

I might also recommend this one for your purposes but it is too big for me to upload:

Behavioural modification of the cholinergic anti-inflammatory response to C-reactive protein in patients with hypertension.

1 Like

For beginners, some easy non-research articles on HRVB. Helps explain how RSA blood pressure and breath work together.
Section 10 how does hrv biofeedback work.pdf (98.6 KB)
Section 13. Future directions.pdf (1.6 MB)

3 Likes

thank you

Ah, I found one paper on “normal” hrv in my biofeedback coursework. I don’t think this one has been listed yet? (Nunan, 2010). Section 9 review of normal values of hrv.pdf (140.6 KB)

It is summarized on this webpage along with some stuff from other papers: https://hrvcourse.com/hrv-demographics-age-gender/

But yes, I agree with the others that HRV is not commonly measured during and just after exercise if you are thinking of that when thinking of “activity”. However there are lots of studies that look at brief changes in phasic HRV in response to stress. Usually they give someone a mental challenge, or the hand grip test or cold pressor test which are meant to stress your nervous system a bit. For example:
https://www.ncbi.nlm.nih.gov/pubmed/21365308--
Effects of heart rate variability biofeedback in subjects with stress-related chronic neck pain: a pilot study.

They look at three things: before stress, during stress(reactivity), and after stress (recovery). Usually all in the course of 15 minutes or so.

2 Likes