I’m paying attention to my HR in various situations for a while now, and just started with more continuous (longer periods) tracking of HR and HRV using Polar H7 and Heart Rate Variability Logger app. I was just wondering if there are some guidelines to ‘healthy’/normal HRV values and how consistent these values should be within one measurement.
Right now it’s a bit difficult to interpret the measurements.
I’m having quite a lot of health issues at the moment and will be seeing a heart specialist later this week and I want to be as prepared as possible so was looking for some meaningful measurements and insights.
Range will depend on many things - including age, health and fitness.
Great article from Marco Altini on this:
Note - the units of measurement differs per app. Many apps have their own custom ‘scores’. Check out the app you’re using, there’s generally information on the app.
And of course, I’d highly recommend Marco’s app - HRV4Training. Works with the iPhone camera. iOS only for now though.
The better shape you’re in, the easier it is for your heart to speed up and slow down not only in response to exercise, but also as you breath. HRV measures mostly reflect latter.
I wouldn’t obsess too much over the absolute values, but keep track of how they change over time.
Thanks… I’m a bit obsessive at the moment since my heart rate during the exact same excercise load can differ 20 to 30 beats / min. on different days which makes it quite difficult (impossible) to train on HR targets.
When ‘under load’ I also notice a huge difference in HR between sitting (squated, not on a chair or the floor) and standing.
I can even reproduce this being under the shower (!)
As you can tell I’m trying to pinpoint some quantative matters that might hint me towards solutions/ways of improvement of how I’m feeling overall…
Having a long-term record of your resting heart rate (with or without HRV) might be useful. If you exercise regularly, heart rate recovery time could be another useful measure to collect.
If your heart rate doesn’t adjust properly when standing up (a fairly common problem), that’s something a doctor can test easily during a visit.
When you see the specialist, ask what kind of measurements would have been useful, and report back!
Regarding RMSSD, all I know is that if the value drops below zero, you have faulty software
Thanks, I’ll report back with some examples of my graphs of HR and rMSSD along with what the specialist said tomorrow
Worth noting; I emailed Marco Altini (creator of the HRV apps) with questions regarding the rMSSD values, since I also saw values of 450+. He replied promptly (very nice!) that I should check the monitoring gear as such a value doesn’t really make sense (unless you have heart problems/arrhythmias. I’m confident about the HR values I’m seeing as they are in line with other measurements. As for the rMSSD I really don’t know, I guess the specialist might be able to shed some light on that.
All in all I find this very interesting and also starting plotting Poincare plots for rr values… still digging through the papers to learn how to really interpret those
The specialists told me my ECGs look fine. The high and variable HR and ‘weird/extreme’ response to changing from standing to squating and back could be due to medication I’m taking currently. Will get a final exam on wednesday with an echocardiogram to rule out other problems and then probably will stop taking the meds to see if things will improve.
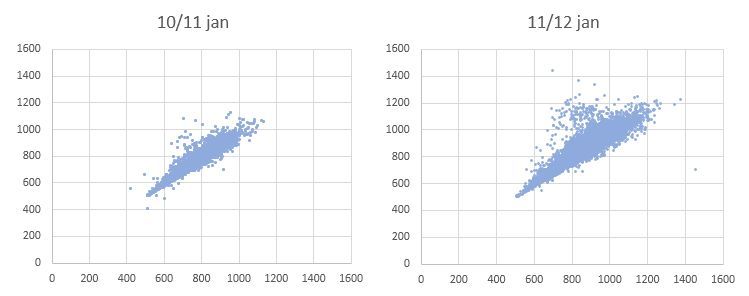
As for measurements of HR and HRV I found the ‘Poincare method’ which simply plots rr(n) against rr(n+1) intervals.
Still trying to figure out the details about interpretation, but you can learn things from looking at the shape of the resulting plot. (width and length)
See below my Poincare plots for 2 nights of sleep.
As far as I can tell, higher HRV values equate to healthier heart. The additional factor for me is NN50 - ideally zero, I believe that this indicates how my atrial fibrillation is going; so again, zero is best.
I use Elite HRV with Polar Bluetooth; this app shows NN50 directly (no disabled part needed).
As far as I know, any atrial fibrillation is suspect and indicates a need for more in-depth checking. I’ve had it for some years and seem to function OK, but such a condition is a risk factor for heart problems/attacks. I initially downloaded all the NRV data for each exercise and laboriously counted each spike I had - that’s an AF to my knowledge. I then correlated with NN50 and found a virtual 1:1 correlation so now just use that as my count. So I’m tracking that with all my other lifestyle metrics/variables to find meaningful correlations with, of course, a hope of minimising such AF events.
I was also looking for the average HRV-charts. This study found that among normal people a normal RMSSD is 27 ms. However, the study group of healthy middle aged men wasn’t that large (N=274), but maybe more representative than the HrV4training data.
This study also shows some nice tables of average value’s over age etc.
Thanks a lot, that’s very useful.
However, one thing I don’t understand is that they don’t seem to take activities into account?
I find that my values will be in different ranges depending on HR/activity
Higher activity/HR means lower rMSSD (for me… makes sense I’d say since RR periods are shorter by definition?)
Well here is a study which investigated the relation between HRV and Physical Activity. In general, athletes have higher HRV-values. However, when exercising, or after exercising your RMSSD drops because of the sympathetic activity/physical stress of exercising. But in general your RMSSD becomes lower (if you not overtrain). Thus, the relation depends on how you analyze your data.
What I’m interested in is to see if there is a way of learning something about the HRV during excercise. Perhaps a ratio to your rest HRV or something like that.
Mainly looking for ways to learn more about some of the weird observations; heart rate dropping 50 bpm when beeing squated versus standing up straight (130bpm upright, 80 squated… and I can repeatedly reproduce these values)
Or me reaching max HR levels really quickly during fairly static sports…
Maybe it has to do with the high max HR I have (measured 202 without a specific max HR test, while I’m 36) but just digging through the options of HRV to tell me more
Aha, now I understand. When exercising, the sympathetic system takes over. Your parasympathetic system allmost retracts completely from influencing your heart rate during exercise. RMSSD, PNN50, and SDN50 are parasympathetic measures, therefore they become (close) to zero when exercising (that is no faulty software).
I’m not sure which value of HRV there is that is useful during exercise. Maybe you can do something with your Poincare plots indeed. Btw: the app HRV expert returns these plots directly, but you can’t export your data in this app.
Cool, yeah that makes sense.
It’s interesting to see how these value differ depending on activities, or even within same activities like simply having a conversation. (depending on subject perhaps? )
I’d prefer to have the data in csv/excel so I’ll just keep generating the poincare plots…
Maybe need to figure out how to automate that with R or Python or something
For this to be meaningful, I think you have to add in the respiration rate and blood pressure. We find BRS - baroreflex sensitivity to be a better measure of the health of the autonomic nervous system - ideally looked at during stress and non stress periods.