Hi John
Could you share some screenshots of the earlier records in your collection, it would be very interesting to see how your collection of variables has evolved over time?
Hi John
Could you share some screenshots of the earlier records in your collection, it would be very interesting to see how your collection of variables has evolved over time?
Not sure of the question, but the basic format has been the same since almost the beginning. There’s been various layout versions. What you can’t really see is the brilliant way it offers the various choices due to the programming structure. If it’s a physical choice, you get the physical options. Each of the 9 words has it’s own pick lists.
I meant could you show me what you tracked for the equinoxes of 1999. I’m spiritual like you and I’m curious how you spent those days?
Well, my current data set is from 1/1/2014. To go back that far I’d have to dig into some backups and do some consolidation of data. Currently there are 60481 records not counting this one. I could print the exact days activities if I went into the archives. I would assume I was meditating at some point.
With the current data set I have
38 days:16 hours:13 minutes of meditation.
approximate 1550 days, so divided is .60. So is that an hour or 3.4 of an hour? Can you even divide minutes into days?
Sounds about right. The reporting part of any of this is hit or miss
I know the data is normalized, I don’t really do many reports.
In the past week I’ve meditated 7.25 hours, so that sounds about right. And is easier for me to understand.
John
Hi John, am I right to understand that you have 25 years of archived data but have rarely or never used it for any reports, and you currently only have convenient access back to 2014? This question is judgment neutral, I think that’s interesting that you’ve invested the time and energy in creating the record, and this act of tracking has enough value to keep you at it, even without doing any analysis. (Or, “hammering away at the data.”) That’s evidence of a kind of value that isn’t typically acknowledged in explanations of the value of self-tracking; that is, the value of the activity itself.
That’s evidence of a kind of value that isn’t typically acknowledged in explanations of the value of self-tracking; that is, the value of the activity itself.
That’s a great point Gary. After five years of self-tracking, my feeling is that these benefits (see related thread on Hawthorne effect](Hawthorne effect in QS), are real but also hard to quantify.
Sergio
– Hi John, am I right to understand that you have 25 years of archived data but have rarely or
– never used it for any reports, and you currently only have convenient access back to 2014?
Yes, this is a very accurate depiction. Although I believe I could get back to 2004 based on what I getting ready to attempt maybe, to gather it all in one place.
– That’s evidence of a kind of value that isn’t typically acknowledged in explanations of the value of
– self-tracking; that is, the value of the activity itself.
I wouldn’t go that far. 
I had a driving purpose, which was to prove the GHS philosophy with a software proof, which I have. As opposed to just having it in words like a philosophical article. I suppose there was a longer term goal of making it easy for other people to do the tracking so they could “hammer the data” which I call a “report” btw.
One point I don’t think you guys would see at this stage is that everything everyone on this site is tracking goes under those 9 words. I could place all the data anyone has tracked and pin it somewhere, like an outline format really, somewhere to be drilled down to so you could hammer it. It would also expose faulty questions or premises that would invalidate tracking something in some way that wasn’t useful. But only for a single person, not a group. Group evals would need to group and then do whatever. Like average of sleep per however many people tracked sleep, etc.
As part of this process I also figured out How Relationships Work (or don’t) to the level of normal words everyone uses which is part of the mystery of the next paragraph.
As amazing as the GHS philosophy, science, and art is, I’ve never had anyone even remotely get to the level of grokking it, which I’m sure is a word people here understand. Whereas I thought it was instantly understandable the second it came to me. I think I’m like that guy who went in front of all the smart scientists of the time and suggested that the periodic table was based on notes, and then he got laughed out of the room until it was proven after he died.
I guess I’m going to have to look at this and see what it means?
OK, The Hawthorne Effect: One Comment:
**–The reason I posted this in the forum was to bring focus on benefits of self-monitoring so that **
–QS can be recognized as a form of treatment instead of considering it as just an experimental method.
I guess treatment is a word, I prefer to call it awareness. Self awareness here perhaps?
There is definitely a concept, I learned about in Scientology (don’t hurt me) called “as is” ing. Where if you truly see something as it is, it disappears. Which is part of why I feel logging food, or sleep, or exercise provides insight.
It’s particularly cruel if you log relationship interactions. I feel like a lot of people don’t want to actually know How Relationships Work, because it tosses into their face that their relationships aren’t working and this blows their little fantasy that they are.
I did an rel eval for one person who was vaguely unhappy with his “friendships.” He named his 10 best friends. Based on the facts, zero of them were friends, and his very “best friend” interaction was based on when the guy needed to be picked up at the airport.
I always felt knowing what was wrong was better than ongoing lifetime denial. Apparently this is an acquired taste.

You lost me at “Scientology.”
Why did you need to normalize the data?
This is a term used by software professionals. The reasons are self-evident if you know the meaning of the term.
Definition - What does Normalization mean? Normalization is the process of reorganizing data in a database so that it meets two basic requirements: (1) There is no redundancy of data (all data is stored in only one place), and (2) data dependencies are logical (all related data items are stored together).
Nice! I store all my data in a relational database. Right now I passively track:
I’d like to create a passive mood tracker, something that can determine my mood based on a photo that I take (either by desktop or mobile).
why would you like to create that type of tracker?
Compliance tends to drop with manual input. Having an automated passive mood tracking system could simplify this process. (E.g. a camera aimed at where your desktop sits, that takes random snapshots to determine your mood throughout the day will have much higher compliance than an app asking to rate your mood)
I see. For your laptop it should be easy to script that solution. https://github.com/lolcommits/lolcommits has been doing it for some time.
I don’t think passive mood detection is that easy though.
Gee, Excel Pivot Tables Who Knew?
This is Jan 19 data.
Seems like I can slice and dice my data however I like with Pivot Tables. I could also do this in FM reports of course, If I wanted. The problem here is that the transactions are sorted out of order which is irritating in Excel. Another reason I like FM.
Only need 7 fields to do the whole enchilada. If I knew how to sort properly, and total the times in Pivot tables, the data is there. It was sorted in FM.
There’s a deeper level down, but that data looks a little personal, but it’s there. Actually it goes two levels deeper. There’s Cook, then Breakfast or lunch or whatever, and then drill down to what I made.
Or Read, then Books, Magazines, whatever, then drill down to the title.
It’s also 1300 rows long if you want deal with all of it. but it is pretty amazing to look at if I do say so myself. 999 transaction for the month.
J
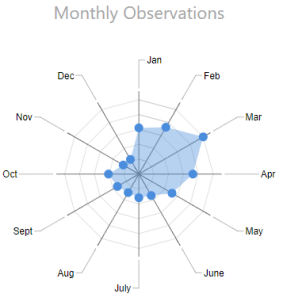
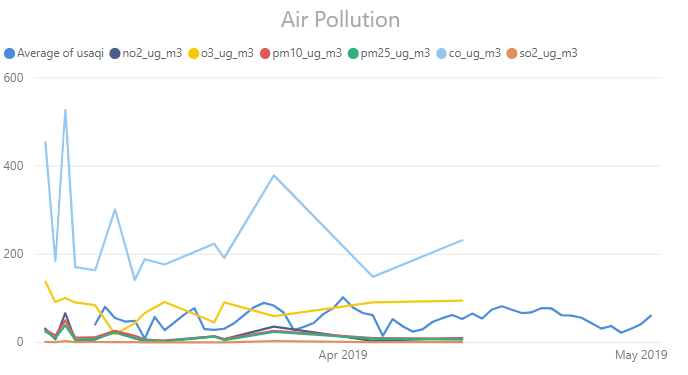
While on the topic of tools, I see a lot of mentions to Excel and FM but surprised that in 2019, i still see very few mentions of Power BI (or similar self-service analytics tools) from this community.
I can safely say that I self-track thanks to tools like these. Without revealing any confidential information, here are some small examples of how I am using them:
Tracking monthly health observations (March = Allergy season)

Tracking weight according to CDC standard growth charts:
Tracking air quality:

I made this offer before, if anyone uses Filemaker Pro, no one’s even close to what I do.
@Dr_John
John K. Pollard,
Assessment of human life.
There is a common option based on objective assessments of human behavior.
The human ethology was used.
There are few indicators.