Hello all,
When I started to quantify myself, I suffered from the data silos. Most of my data were spread into different vendor databases (Jawbone, Rescuetime, Withings).
Then, I had no easy way to match my own tracking data to the one collected by my sensors or my softwares. Some web application allows to aggregate any kind of data but I don’t feel safe by giving my whole life details to a third-party. It was a really a problem, I had no way to compare my tracking data efficiently. Thus, it was hard to give meaning to them.
So I decided to scratch my own itch and build two free and open source applications: one that collects data from my sensors and softwares and another one that offers hand tracking capabilities and dataviz. Both can be hosted on any hardware (a miniboard, a dedicated webserver, an amazon ec2 instance, etc.). Guess what? After three months of usage, I’m quite satisfied with them. Simply because I discovered some patterns about me:
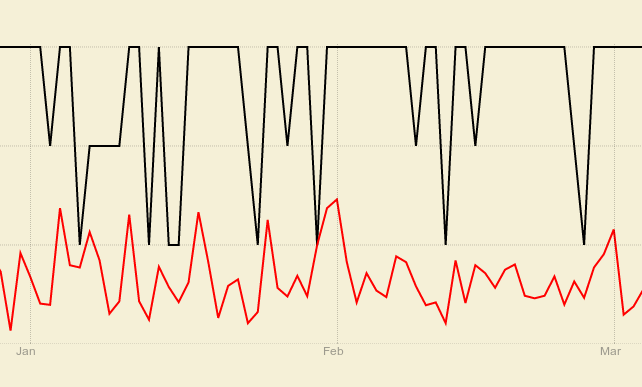
When I’m in a bad mood I tend to do less walking (mood is black, steps in red).
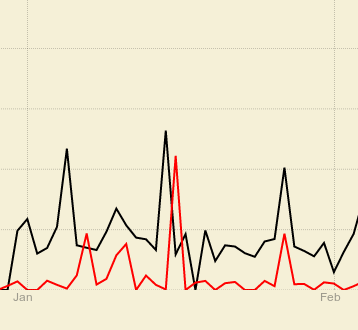
In January the amount of money I spent followed the same variation as my sleep duration (sleep in black, money in red).
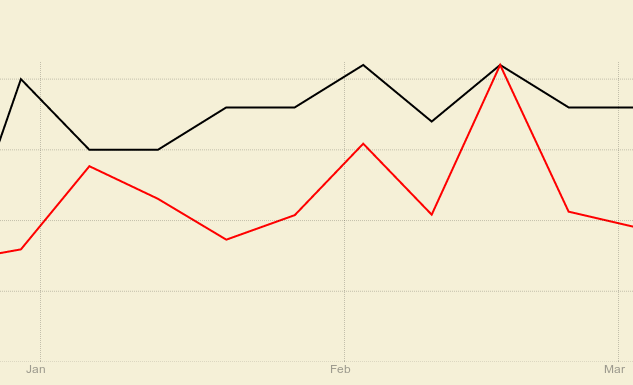
On a weekly basis, my “amount” of mood tends to follow my sleep duration (mood in black, sleep in red).
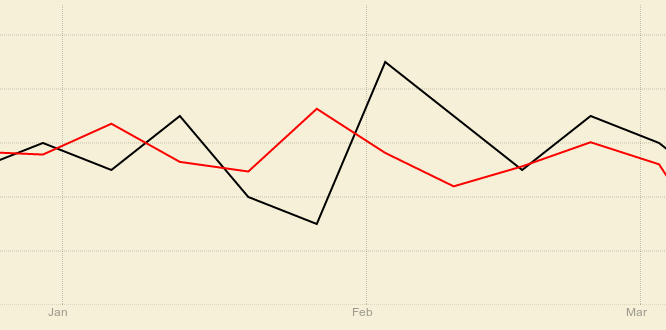
On a weekly basis, my amount of tweets was the opposite of my amount steps (tweets in red, steps in black)
And what is fun is that in March these tendencies changed. So it looks like quantifying myself has an impact of my behavior (or maybe it’s due to a of warm spring here in France ;)).
**Why it is related to the Personal Data Task Force? **
Here are details about the two apps:
Konnectors
Konnector is a simple app that allows to fetch data from different vendors. Jawbone, RescueTime and Twitter are supported. A Withings Konnector is on the way too. But the important thing to understand it that Konnectors enables the Personal Data Task Force (described by Ernesto Ramirez).
Konnector is easily extensible. It is plugin-based. Every konnectors are available on Github and are coded in a single file. So anyone can build a new konnector without worrying about the application architecture. The only constraint is to follow the convention set (not documented yet but you can start from an existing konnector).
Konnectors list and code
Demo
KYou
KYou is a simple dataviz tool that allows to display data stored inside the Cozy platform. It provides a too to see data aggregated by week or month and to compare them with other trackers. The aim of KYou is to make self-monitoring simple. It allows only discrete values, the smallest time unit is the day, you can visualize only six months of data and all trackers can be visualized on the same page. Once you start using it you have an easy to read dashboard of your life metrics.
It is a plugin based application too (list here)
Demo
NB: KYou and Konnectors require the Cozy Platform to run (Cozy is a startup project I work on).
I would be glad to have feedback from the QS Community about these both apps. You are doing self-quantifying from far longer than me. So, I have a lot to learn from you. If you don’t want to write them on this forum, you can send me an email at frank [at] cozycloud [dot] cc . I’m ok for a Skype talk too. That would give me hints to write the roadmap for KYou and Konnectors!
Thank you for your attention!