Yes please.
QS Archive Tools List.csv (12.7 KB)
There is a lot of archiving/data quality work that could be done to make this more useful, but it hasn’t been done and there’s little prospect of having time or money available to do it any time soon, but still glad to provide the raw expert if useful. There is also a link between tools and projects, but this isn’t very certain.
1 Like
Good job! Thank you. Nice work!
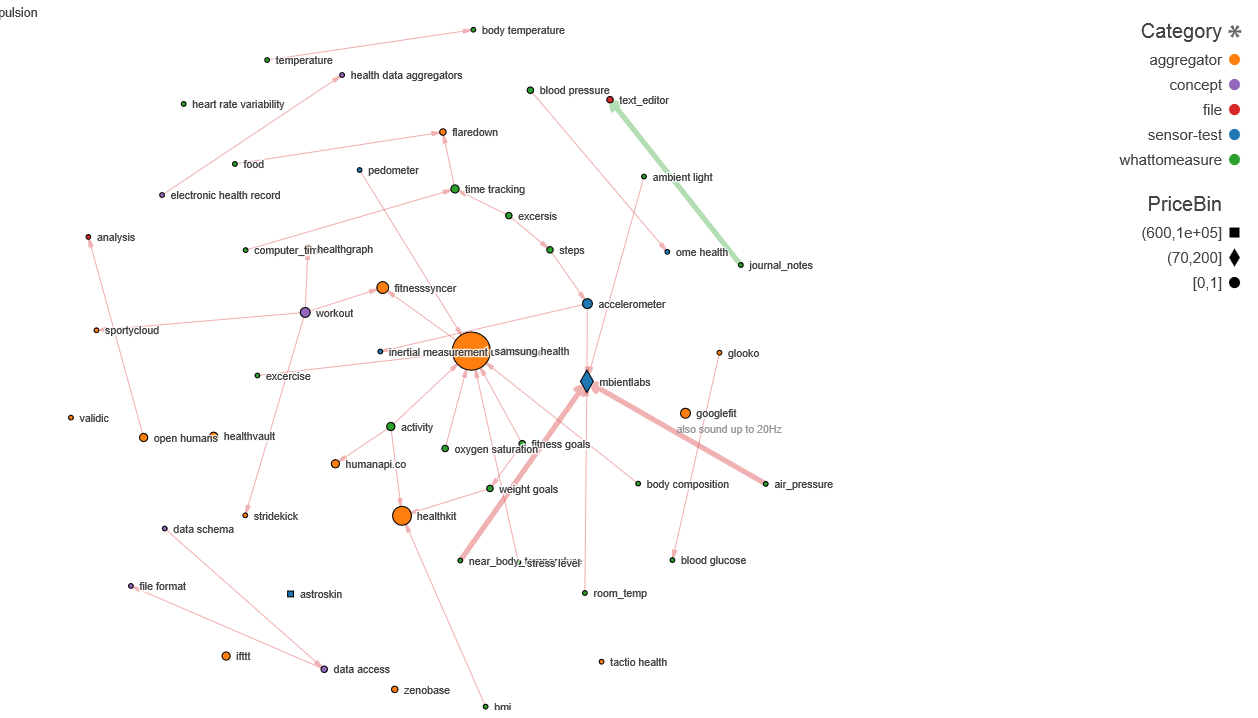
The data base is not completely cleaned but even now its way too big. My out of date system can not even show the whole thing without crashing. Way too many links. And worst of all any kind of information that the links provided is covered by other links except at the periphery. In order to make the following snapshots I had to filter nodes to only the ones that are connected to 6 other nodes. Number of connections is called degrees and it defines the size of each node.

One simple option is to let the user use a much better machine than mine and netCoin’s GUI filtering. Like this:
Many options could help clean up. Disable defunct products. Group very similar things together as one node (e.x. smartwatches). Just disable most similar things of a set. Make many separate nets to focus on one part of the network such as all higher level concepts or blood glucose. EgoNet kind of does the last example. Let user setup R and then generate networks or suggestions based on user’s input, such as all ways to flow from blood glucose data to file. And finally I could go looking for a different piece of software; something that could automatically plot the network out better.
We found this problem vexing conceptually, aside from any technical issues. There are sometimes really significant differences between self-tracking tools that have similar names (for instance, two different versions of the Apple Watch, one with heart rate tracking and one without). The tools are then used in projects, where it may be ambiguous whether some particular feature was ever relevant, and it may be unclear which version was in use. These are not rare problems, but rather typical.
1 Like
Graphing script could collapse very similar things depending on number of nodes. Like zooming out. Data would not be affected. At moderate zoom, user would find out there is an Apple Watch that could do what they want. This would only work in combination with limiting the graph by pre-making or letting user specify. Or maybe there exists some graphing software that can zoom like this as user interacts with it?
Its pretty much D3… https://stackoverflow.com/questions/26521539/d3-example-for-network-visualization-having-collapsible-zoom-feature
https://softwarerecs.stackexchange.com/questions/67034/network-visualization-tool-with-collapse-and-expand-capability-for-groups
Now where do I get a D3 developer?
*Feature request ; Correct errors directly from graph GUI…
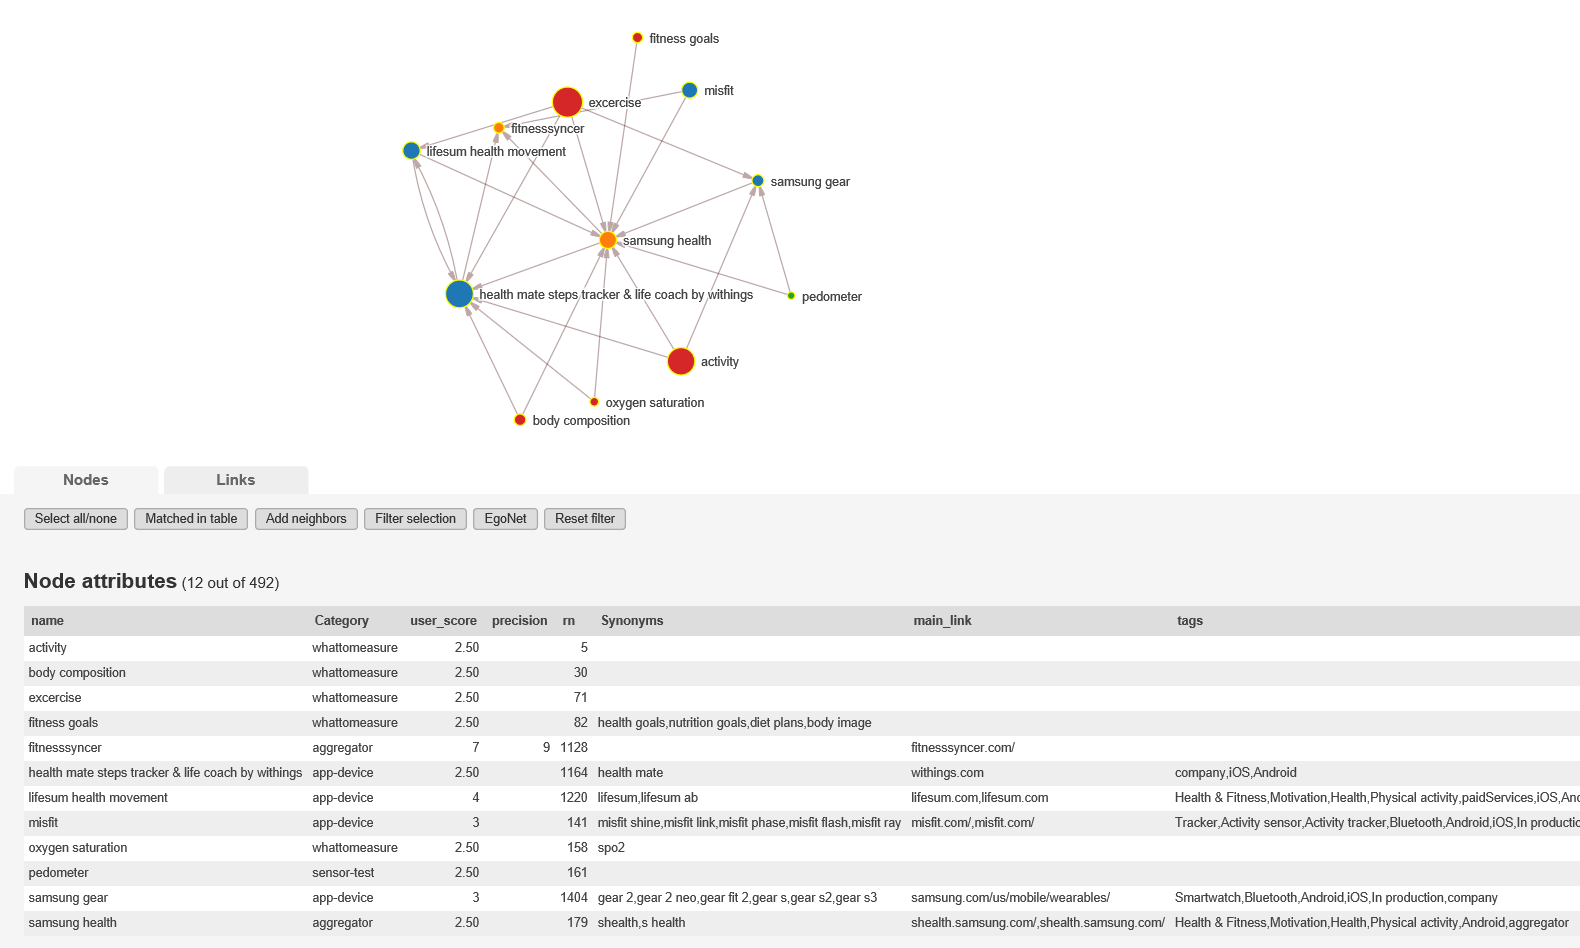
Here is Devices and Apps removed. Shows off some errors.