I don’t believe there’s any need to control for training with repeated within-subject sampling, since there will be as many samples on both control and active days drawn from the later “trained” period" as with the initial period. But yes, my D5B scores seem to have plateaued pretty much and only very slowly increase; you can look at the stats: http://www.gwern.net/docs/gwern-bw-stats.txt
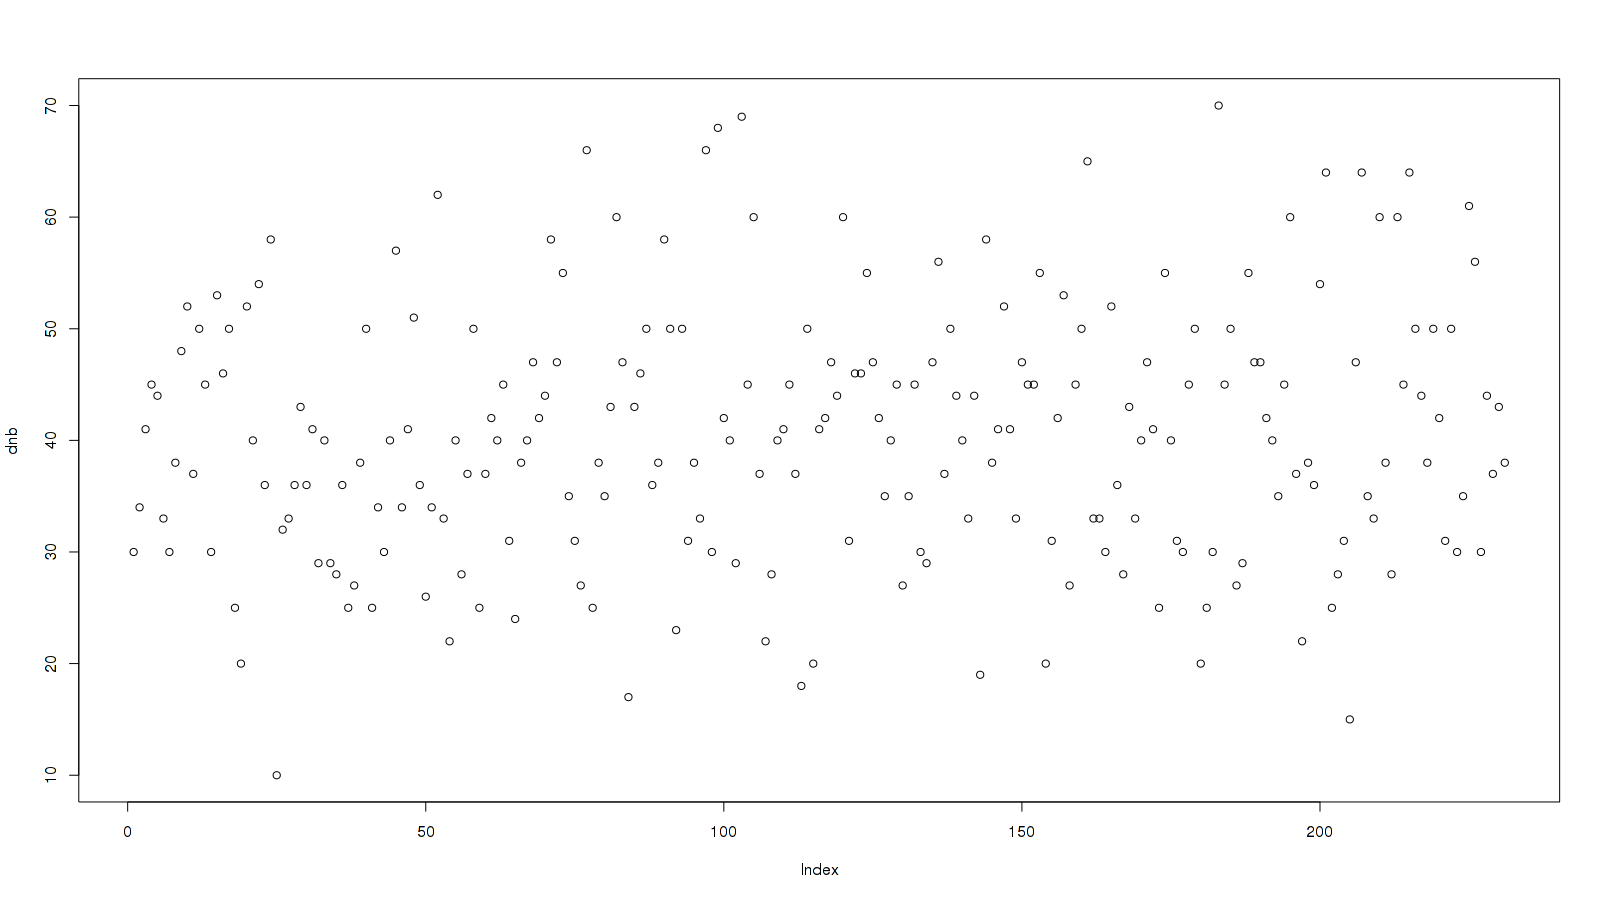
Or a graph of my last x00 scores:
R:
[code]> dnb ← c(30,34,41,45,44,33,30,38,48,52,37,50,45,30,53,46,50,25,20,52,40,54,36,58,10,32,33,36,43,36,41,29,40,29,28,36,25,27,38,50,25,34,30,40,57,34,41,51,36,26,34,62,33,22,40,28,37,50,25,37,42,40,45,31,24,38,40,47,42,44,58,47,55,35,31,27,66,25,38,35,43,60,47,17,43,46,50,36,38,58,50,23,50,31,38,33,66,30,68,42,40,29,69,45,60,37,22,28,40,41,45,37,18,50,20,41,42,47,44,60,31,46,46,55,47,42,35,40,45,27,35,45,30,29,47,56,37,50,44,40,33,44,19,58,38,41,52,41,33,47,45,45,55,20,31,42,53,27,45,50,65,33,33,30,52,36,28,43,33,40,47,41,25,55,40,31,30,45,50,20,25,30,70,45,50,27,29,55,47,47,42,40,35,45,60,37,22,38,36,54,64,25,28,31,15,47,64,35,33,60,38,28,60,45,64,50,44,38,50,42,31,50,30,35,61,56,30,44,37,43,38)
plot(dnb)[/code]
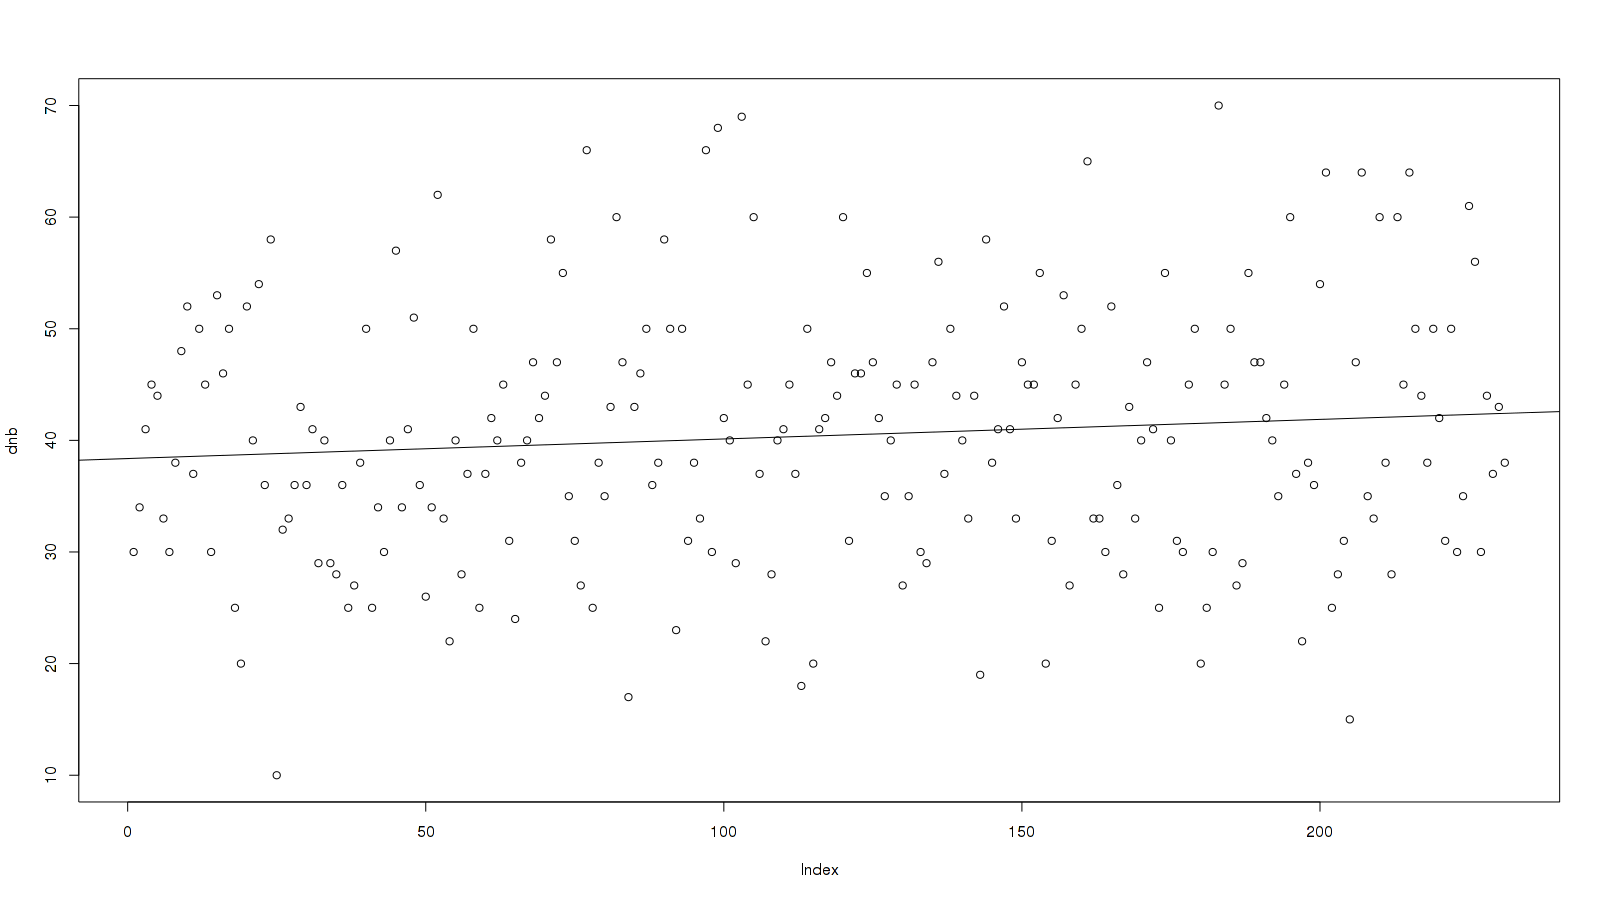
The point about randomization is key, BTW, because the theoretical training effect is actually greater than the observed improvement between randomized days. Watch:
[code]> lm(dnb ~ c(1:231))
Call:
lm(formula = dnb ~ c(1:231))
Coefficients:
(Intercept) c(1:231)
38.37041 0.01752
0.017 is a positive slope!
graph the fit
abline(lm(dnb ~ c(1:231)))[/code]
It’s not much of a slope but it’s there. Now, I spent 200 rounds of n-back doing the randomized nicotine experiment, and those would be the latter 200 rounds graphed; how much of an improvement should I expect?
The model is given just from the coefficients: y = 38.37041 + 0.01752*x
We want the endpoint, score 231, and what is 200 before 231? 31:
(38.37041 + 0.01752*231) - (38.37041 + 0.01752*31)
3.504
Notice that 3.5 > 1.1. So if this was just training effect, why isn’t the “benefit” from nicotine greater?