Personal Dashboards for Self-Tracking Data

This is a general topic for discussing ideas about personal dashboards for your self-tracking data. I started it with some posts from earlier topics that were happening on the forum, sparked by @LNP.

I apologize for some slight timeline issues on the posts and making small edits to add coherence, but I think it will be worth it. #virtualbreakout

2 Likes

Would you be interested in:
the ULTIMATE tracking aggregator with analytics and custom dashboards?

(SIMILAR TO EXIST.IO BUT WITH MORE CUSTOM FUNCTIONALITY)

I’m thinking about building an online platform that will be different from Exist.io in the following ways:

  • It will also support the upload of .CSV files from unsupported trackers and define custom scripts to extract attributes from those files.

  • The custom tracking will also allow for numbered variables, and can be sorted into different groups!

  • You will be able to create your own pages and subpages with custom dashboards! (Visualize any combination of variables with a scatterplot, timeline, etc.)

Comment “I’m interested” if you would like to know if I build this platform ! :smiley:

Also… Is there anything else that you would include in a platform like this?

1 Like

Hi Lars,

I’ll offer some counsel based on a decade of observing projects similar to these. The goal of having a dashboard like product to track everything has attracted dozens (perhaps even hundreds) of programmers. Sometimes these were commercial projects, sometimes they were hobbyist or community or more generally open projects. A few have survived. Zenobase, exist.io, and Gyroscope are the most well known examples in the QS Community. (Q: Who am I leaving out?) In general this has proven to be much more difficult than most people realize when they begin, due to heterogeneity on both sides of the system: users have more divergent needs than is obvious from the beginning; and, data flows from services and apps are more idiosyncratic and less stable than is obvious. You have to be prepared for a long haul. Maybe you have source of income that allows you to tinker freely for years; that’s great. Or perhaps you have a startup intensity that allows you to raise money to support the development and customer acquisition phase. That can also work. Or maybe you have a specific use case you envision, a problem to solve for people who have no other solution and will pay you for your early versions and support you as you go forward incrementally. Also can work! But I encourage you to ask the question: How does this survive for, say, three years in a way that allows me to devote significant development and support time to it.

An alternative approach is to contribute to the development of an open collection of Jupyter notebooks. See this section of Open Humans for some inspiration: https://exploratory.openhumans.org/.

Open Humans can manage the user authorization workflow. Then you can build your own
dashboards and share them in a variety of ways, as well as run them at a URL and allow authorized users to operate the dashboard with their own data.

This doesn’t work for supporting a commercial path of the conventional sort, probably, but it gives you access to some good technical and platform capacity, as well as to a small but very knowledgeable group of potential collaborators.

Here are some of the notebooks currently available, if you want to browse examples: https://exploratory.openhumans.org/notebooks/

7 Likes

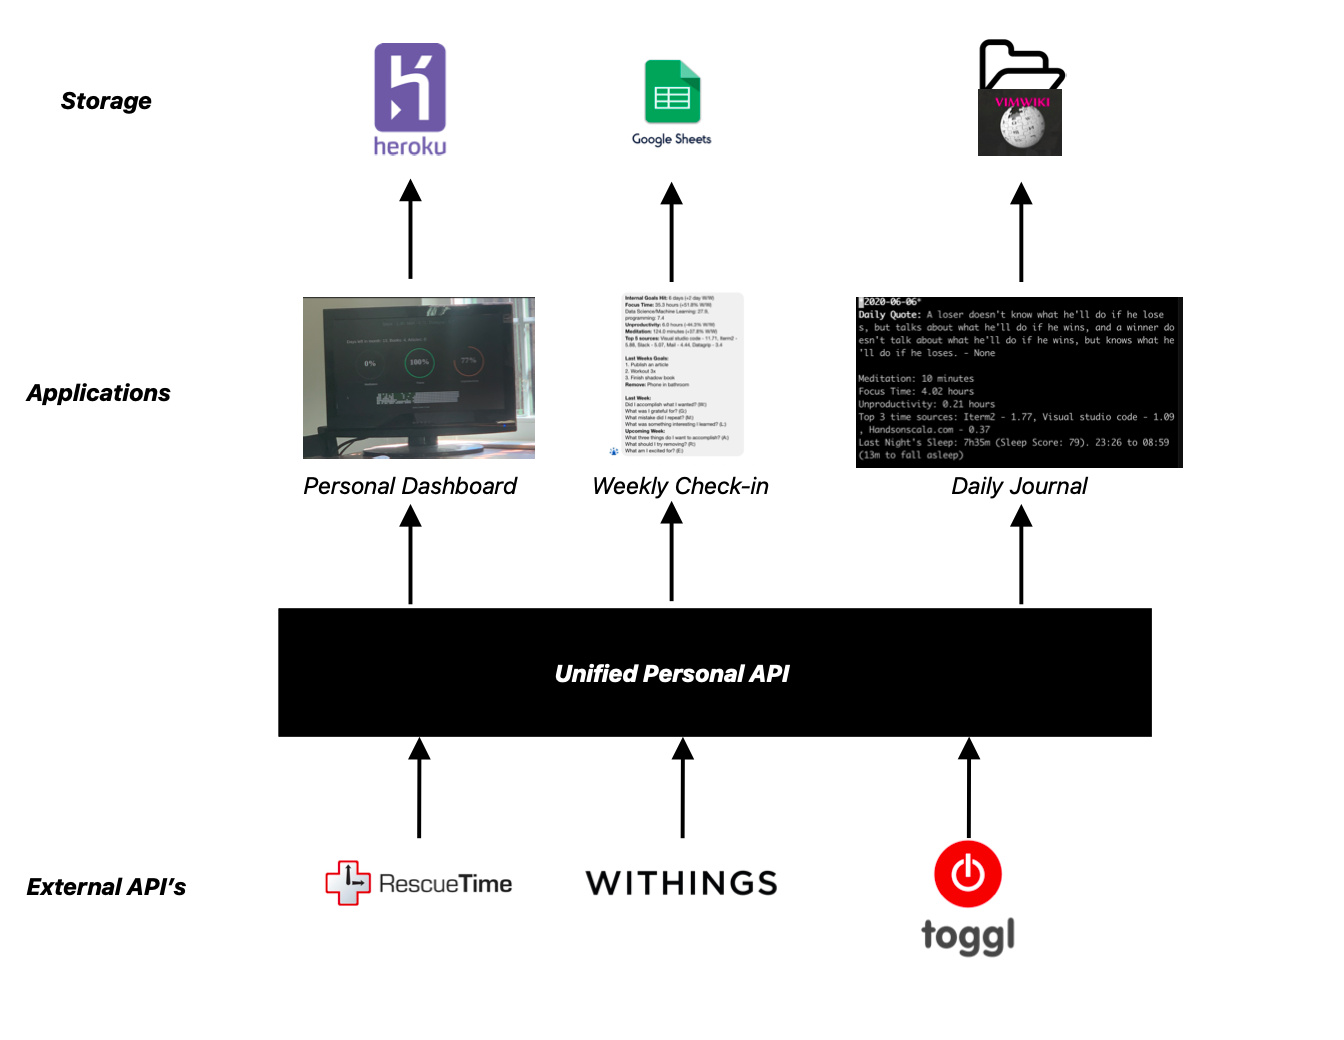
Here’s the open source dashboard I built 3 years ago and am still using today - https://github.com/Andreilys/personal_dashboard
image

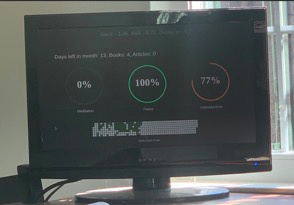
I ended up building this because I couldn’t find any dashboards that were real-time. This creates an annoying user experience where you need to actively refresh the dashboard/app to get your latest data. I wanted to be able to, at a glance, see how my day has been going and make corrections accordingly which is what I was able to accomplish with a combo of javascript long polling and flask.

I’m actually planning on rewriting the whole project and creating a micro-service for the API which will act as an interface for a bunch of my other projects that rely on this data. So if you want to collaborate feel free to email me - andreilyskov [at] gmail [dot] com

4 Likes

Has anyone used PYTHON to create the PERFECT tracking aggregator/Dashboard webapp for themselves?

I’m a Software developer who can’t find an aggregator/Dashboard tool that I’m satisfied with! So I want to hear from the experience of others who have tried to create their own thing, to not make the same mistakes!

This is why I’m not satisfied with Excel/Spreadsheet:

  • I’m using 5-8 different trackers, and their date formats are not consistent, and also the data has to be cleaned up, and I’m not very good at working in VBA/Excel.
    I don’t know how to setup my data, in a way that will allow me to see correlations between variables from different trackers…
    I’m better at using Python, and I will probably also use Python more than VBA/Excel in my Software Engineer career I think.

This is why I’m not satisfied with Exist.io/Gyroscope etc.

  • They don’t allow me to import my .CSV tracking data from Chronometer and Notion.

This is my perfect solution:

  • Each month I download my .CSV files and send them to my E-mail. This should trigger IFTTT to send those .CSV files to my Webapp by using my webapp’s public API (Or will this be overkill? Don’t know how hard it is to make a public API…)
  • After the .CSV files are sent to my webapp, then my webapp should extract the information about all variables and put it in a consistent format that can be worked with.
    • Do you think it would be best to put it in a consistent format in a database or a new .CSV file?
  • After I have the data in a consistent format that can be worked with, I should be able to do the following:
    • See change through time on a graph for each variable, and also put more than one variable on the same graph.
    • Making scatterplots with 2 variables
    • Find correlation between any 2 variables:
      • The 2 variables both can be numbers or both consist of categories or one be a number variable while the other consists of categories.
      • I should be able to pick a variable, and then the webapp calculates the correlation between that variable and ALL other variables and present a sorted list.
    • Maybe also other useful ways of working with the data? I’m new to this whole field, so I don’t know of other useful ways of working with the data…

My questions to you:

  • Which mistakes did you do when trying to create your own aggregator/dashboard webapp?
  • Are there any of the things I mentioned where I could have used existing solutions, instead of coding them myself?
  • Are there more automated ways to get data from my 5-8 different trackers to my webapp? Not all of them have public API’s. Is the only solution then to download the .CSV files?
  • Would there be any benefits to making this a local desktop app instead of a webapp?
  • I want to store information on more than 100 variables through hopefully more than 50 years. Would it be best to put it in a .CSV file or actual database? And which kind of database should I use? I’m pretty new to working with databases…

I would love to chat with others who are also passionate about Quantified Self and Software/IT, who can guide me in the right direction :slight_smile:

1 Like

Hello Lars,

I’m in the same process as you are :slight_smile: building a QS dashboard using python. It’s something I have been thinking of for a while but haven’t started until a couple of weeks ago. Here are some of my thoughts on my experience so far as well as some of the questions you asked:

  • START WITH A VERY BASIC MINIMUM VALUABLE PRODUCT (MVP): that’s really the most important thing I believe: draw what the most basic interface would look like for you, and get into coding it right away instead of trying to build the complete / complicated final version you have in mind. Here is my MVP for example: a simple dashboard connected to my OURA ring data, and displaying the time I went to bed over the last 7 days. Looks like this:

It’s ugly (no CSS effort), its incomplete. But it is still something I DO watch everyday when I boot my PC up. 2 reasons to focus on an MVP: 1/ it’s something tangible so it motivates you to continue, 2/ you’ll already have to learn and do a lot to have even a basic thing working (chose a library for building the interface, connect data to the API, learn how to embed a graph, …)

  • For the interface I’m using dash. Advantages: easy integration of interactive plotly graphs (it’s done for that). Drawbacks: less flexibility than other solutions like React.js (which I don’t know yet, so learning dash is easier)

  • For the database: you can start with a very basic SQLite database, which is a SQL database but stored in a file (no need to install any additional DB software), then upgrade to an MySQL or an equivalent. But at the very beginning (for the mvp) just stick to csv files, then make it more robust.

  • for importing your data, you could add an “upload” block direclty in your interface (drag and drop your csv) so you don’t need to go through an intermediary email. (just an idea)

  • I personally am not interested in correlations for now, as I find through my experience that its a lot of noise. I’m focusing on building something that gives me a good and flexible view of the metrics I care about so that I can myself spot correlations just by watching the trends. Automated correlations are definitely not on my priority list.

Start small, then progressively move towards your ‘100 variables through hopefully more than 50 years’ vision.

6 Likes

I was also considering using dash to build the dashboard. Can you expand more on why it isn’t flexible? What can’t you do when using dash?

https://plotly.com/dash/ ? it just draws things it does not aggregate, clean or analyze. Its the last step in your Python journey.

@LNP it is flexible, works fine. It’s just less flexible than more complete frameworks like React.js. I’ve run into a problem for example where I can’t assign multiple callbacks to a same output, there are some workarounds but it is a bit clumsy. Also it does not play well with adding your own custom javascript code. But for an MVP it does the job very well.

This may be a foolish suggestion as I’m over my head technically, but would there be a benefit in “joining forces” using the Open Humans platform to collaborate on dashboard development in a notebook anybody can run?

2 Likes

I’d be interested in a virtual conference! Happy to volunteer some time as well to make it happen.

1 Like

Good discussion in this post. I am searching no. of sites for tracking data information. I never got this data. Finally i get here the complete useful information regarding personal dashboards for self tracking data. thank you for sharing.

If you’re interested in correlations, a hot startup is Bioloop Sleep for improving your performance by focusing on sleep patterns. For Fitbit, Oura and Apple Watch. Worth a look!

The goal was originally the same as yours, but focus is paramount in QS dashboards.


1 Like

Hi Kastan, I agree that focus is important if the goal is to create a product that has a clearly understandable and standard use case to support success in a crowded field of other products. But many personal dashboards aren’t products, but resources for a personal workflow. In that case, they may benefit from being more general purpose aggregators that allow their creators/users to shift focus over time. (What if you wake up tomorrow aren aren’t so interested in sleep anymore?)

Here are some of the self-tracking dashboards I have been using since 2015. Most of the data is observed by me and recorded manually - some tracking dimensions contain data for all members of my family. Dashboards are built using Power BI connecting to data hosted in a cloud-based SQL server database.

6 Likes

Love the dashboards @Sergio! Are they available publicly anywhere?

I recently started playing around with various ways to visualize my data as well, inspired by many of the posts here. It’s unexpectedly difficult to present the data in a clear yet informative fashion.

You can play around with it here: https://alexey.io

4 Likes

I’m interested

How can we flag the post? I want to keep it

I undeleted my post, no need to flag it. I just hadn’t seen anyone else posting “I’m interested” in this thread, so I thought I had responded incorrectly. Would love to see something along the lines of what you’re proposing to build!

Hey LarsNyborgPedersen,

Answering some of your questions:

Would it be best to put it in a .CSV

It seems like CSV is the most universal format now (at least for such kind of that), so I’ll bet on it.

Would there be any benefits to making this a local desktop app instead of a webapp?

Of course. If you’ll decide one day to switch over from Macs to Windows (or otherwise) - web application has you covered.

Are there more automated ways to get data from my 5-8 different trackers to my webapp? Not all of them have public API’s.

That’s true - some of them are not public, some of them are public but you have to pay for the REST API data access (and I think it’s fair taking into account that storage and processing can cost plenty). I’d stick to one platform that allows you to backup/export data to CSV anytime you want.

Hope that helps