Personal Dashboards for Self-Tracking Data

Good article. However, Human API doesn’t publicly list their price, which is annoying. See below.

It’s $700 a month plus a per user cost.

3 Likes

Hey! Thank you for publishing their price. It’s surprisingly expensive. Giving the link to this article I didn’t promote their service, but wanted future implementers to be aware of the complexity of the process.

1 Like

BTW I couldn’t find price on your habitdash.com :roll_eyes:

1 Like

Good point :slight_smile: It’s 99% free right now. We’re still in early startup mode so still building things out / figuring out our features and our pricing.

I wasn’t crticizing about the article, it was a good thought piece for people considering developing their own tools. Just pointing out their price might prohibit smaller projects.

1 Like

Almost everything app I use outputs csv or has a database I can straight copy. Really that just means parsing instead of API calls. This is the work programmers can do. Everything afterwards requires skills in statistics or data science. For example Pearl and causal analysis.

Some work in progress of integrating my data with Grafana (powered by HPI package)

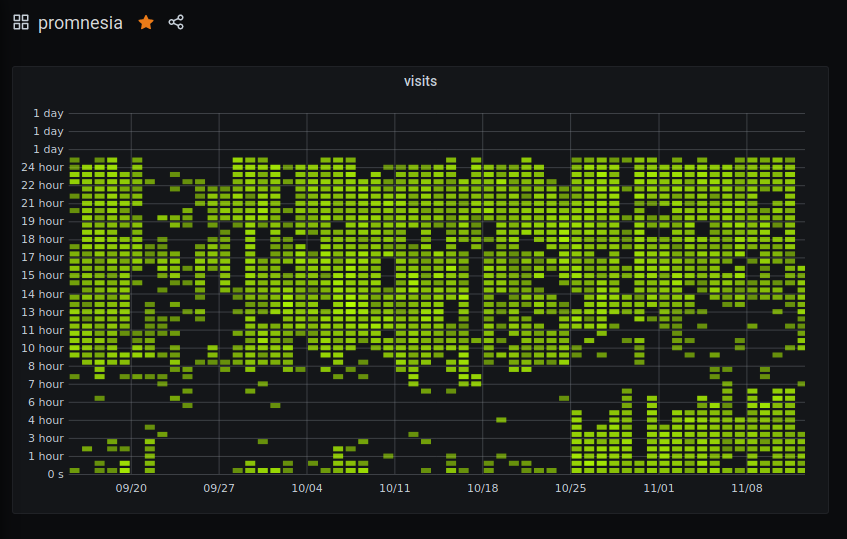
Internet browsing activity (from promnesia )

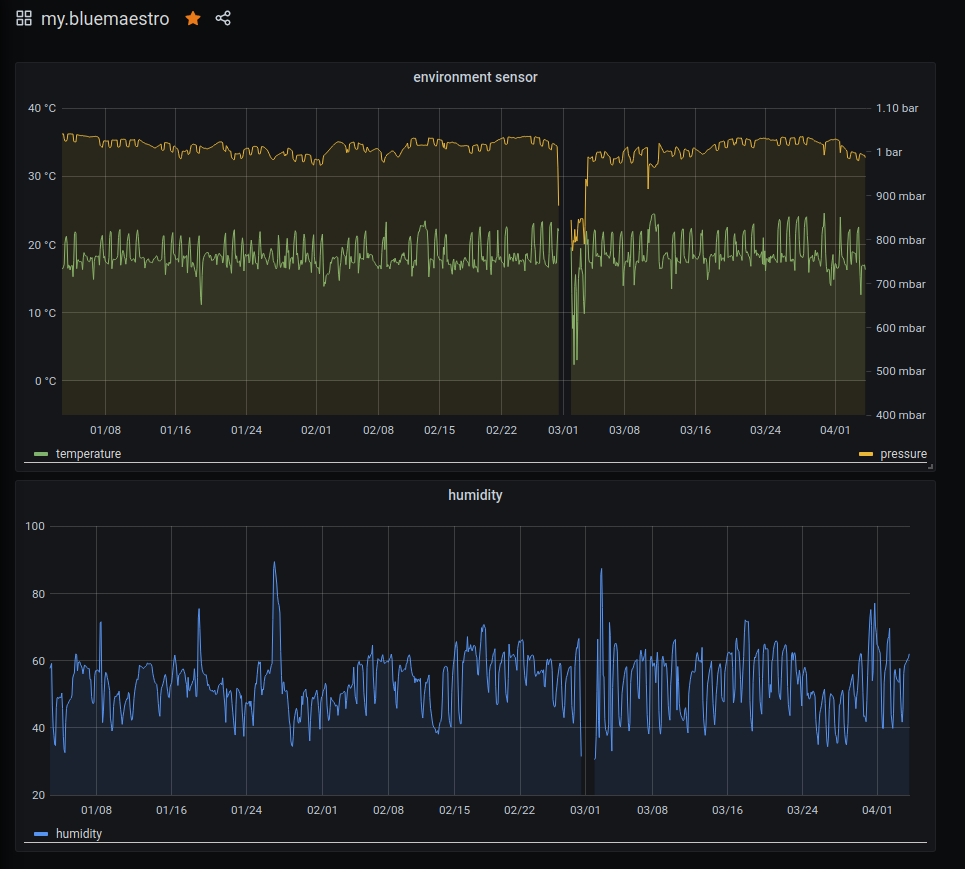
Bluemaestro environment sensor (I’m carrying it with me)

Rescuetime

More is coming… I’ll integrate a couple more manually, and then will figure out automatic interface (so any data source which has timestamps will automatically have Grafana plots).

4 Likes

Hey all,

Like all of us, I’m a huge fan of quantified self apps and self tracking. I am particularly big fan of Whoop for tracking my personal fitness, sleep, and recovery. It actually inspired me to build a similar product but for my work, called Rize. Rize is a productivity tracker that shows you how you spend your time at work, improves your focus, and prevents burnout. I’ve attached a screenshot of the dashboard below.

You can check it out at https://rize.io and if you use the referral code D7708A you get your first month free.

I posted here in this forum back in August when I first started working on Rize and got some great feedback so I thought I’d follow up since I just launched Rize publicly. Right now it’s just a macOS app but Windows and Linux are in the works.

I’d love to hear what you all think and hope you signup! Let me know if you have any questions or feedback.

Thanks,
Macgill

3 Likes

Maybe we could discuss what we think existing solutions for making personal dashboards are lacking? (Exist.io, Gyroscope, Heads up health, Google Data Studio, Grafana, Tableau, etc.)

This is what I think is lacking:

  • Enough integrations with trackers we use (but this problem is hard to solve because people use so many different trackers and not all have API’s)
  • .CSV import
  • Flexibility of data analysis
  • Custom made experiments
  • Good custom tracking with numbers.

I haven’t seen a solution that satisfies ALL of the above, but only some.

What do you guys think? What’s wrong with existing alternatives?

They really don’t do any analysis.

Here’s what we were building lately -> itslili.com
It’s called Lili and it’s a health data insight assistant. We are currently available only for Fitbit users, but will soon open up to Apple Health as well.

Would love to hear your feedback.

1 Like

I pretty much 100% agree with your assessment. I personally would also add:

  1. Automatic backup of data.
  2. API for simple daily import of data (e.g. from manual or unsupported trackers). To me CSV import is inferior solution, especially for dashboard, where the point is to have the data visualized persistently.
  3. I would expand the ‘flexible data analysis’ to following specific analysis that I feel are essential (but I haven’t seen anywhere):
    a. cross-correlation across time to uncover temporally delayed relationships between tracked variables
    b. automatic application of the above to all pairs of variables with report of the strongest relationships found
    c. proper reporting of statistical significance of any correlations found
    d. multi-variate regression

It is worth pointing out that bonus of 2 is that if such feature existed, at least the technically more adept users could integrate many trackers through services like Zapier or Integromat even if they are not supported directly in the dashboard.

1 Like

I recently started a project driven by some of the requirements/needs identified in this topic. The approach is a bit different though, using the same ideas as ‘text based accounting’. I’ve also built several integrations. The work is in progress and feedback is welcome.

Hi everyone!
I’m new to this community which I found researching for this topic.
All the comments here are great insights about what I believe is one of the main reasons to tracking data, the process of the data to transform in actionable information.
I’m also developing a webapp in Python and Django to connect to Todoist and present to you a dashboard, project statistics and has a customizable weekly review space.
I’m not aiming here to create a full all-sources dashboard, I’m mostly designing as a micro-saas.
I’m looking for early users (www.todolytics.com). Please feel free to add any coment if this reasonates with you and subscribe for news. I hope soon will be launching a beta version.

95% confidence interval for correlation may be better than p-value.
also there is multiple comparison issues when people just using same data set at different times… its hard to account for that on software end

Usually, detection of small to medium effect sizes from a small sample and verifying statistical significance requires a statistician skills.

Most QS experimenters doesn’t bother with checking how much observations is needed to reach a statistical power, which normally should be done before starting experiment. Absence of self blinding, confirmation bias, observer bias and other biases adds more problems. Most of these things should be accounted before collecting any data.

So, before building a dashboard, a few not easy to-do steps might be done by experimenter and web dashboard cant account for problems described above.

Even having high quality data and good sample size visualized on dashboard - is far from making data driven decisions. Checking for data distribution, selecting appropriate model (or trying few) to describe connections also not an easy to do without knowledge.

I cant recommend people to read a book about mathematical statistics and start using RStudio for data analysis of CSV files (which i prefer), but without some statistical analysis, just looking at web dashboard might lead to weak conclusions and misinterpretation and should be taken into account.

I hope in future decades we will get a statistical software which knows how to correctly analyze any inputs and interpret the results in casual form, making statisticians lose their jobs :sweat_smile:

1 Like

How? I am having trouble finding books on this.

Apparently multivariate means many outcomes? Explain the difference between multiple regression and multivariate regression, with minimal use of symbols/math - Cross Validated or is this a prank?

Machine learning like Random Forest bc less variance in dependent var more clear the signal between it and any remaining independent variables. Permutation based FDR.

Regarding cross-correlation: cross-correlation works by repeatedly calculating Pearson correlation with increasingly shifted (in time) pairs of signals. This way one gets a temporal sequence of correlation values, where value at i-th position corresponds to the correlation between the two signals shifted by i steps. A temporally delayed effects between the two signals should manifest as a peak in the cross-correlation away from the 0 delay. Of course, as with normal correlation, existence of such peak doesn’t prove causation. Cross-correlation - Wikipedia

Regarding multivariate regression - my bad, I meant multiple linear regression.

1 Like

Hey Alexey!
I love what you’ve done with your site. I’ve been building my own but was blown away by your functionality. Would you be willing to share the source code with me?

Thanks!!!
Scott

your video on youtube is set to private… any chance we can see it?

I can’t figure out which channel I put it on… and can’t find the video…
But I pretty much say the same thing as I do in the post, so there is not much more to see :slight_smile:

This is cool, what devices are you using for tracking this data?