Reaction time vs body weight

I have been tracking my reaction time somewhat haphazardly but tracking my weight more frequently. I use a digital scale to log my weight without clothes and use my own reaction time app to gauge median reaction time (which is typically about 250msec for me). I use an old version of Keep track to log this data.

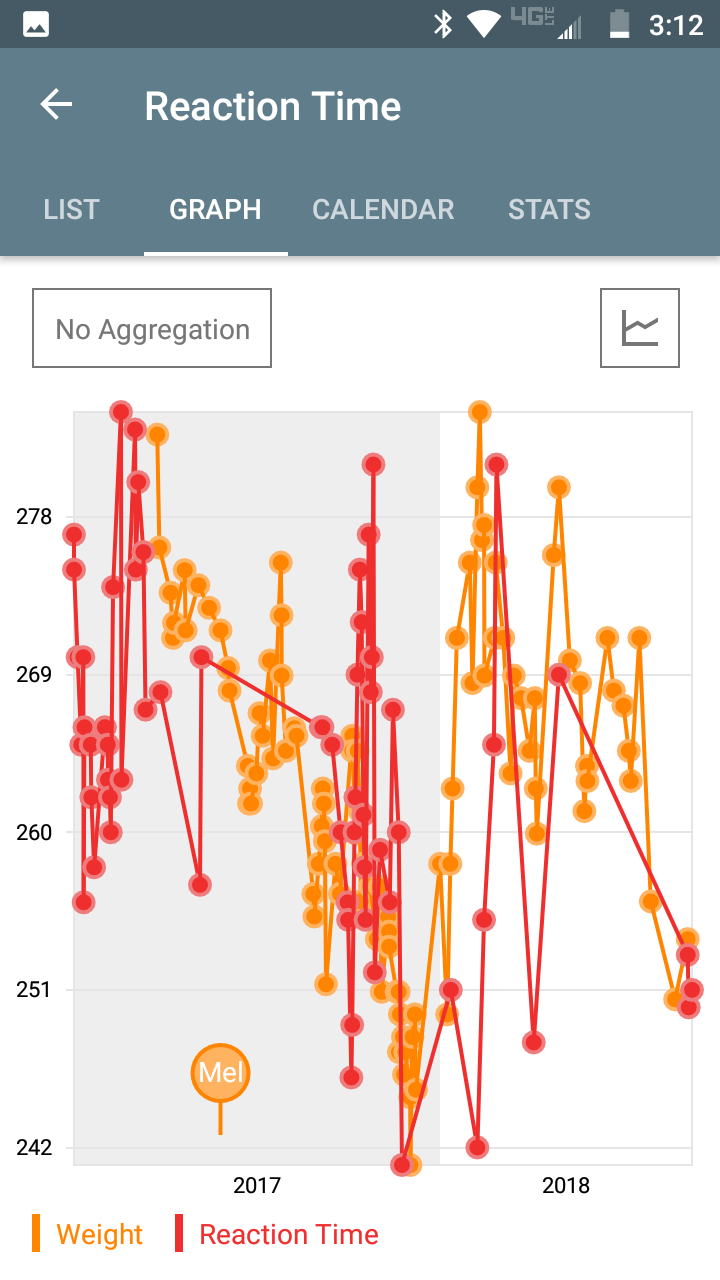
I hadn’t been thinking of it but today I was curious to see how my reaction time data compared with my body mass data. The data is somewhat noisy so I decided to aggregate it over monthly intervals. I got this interesting graph

I didn’t expect to see anything resembling a correlation so I was kind of surprised to see what looks like one.

Here is my visual reaction time app I made for Android. (Disclaimer: really not sure what the uncertainty is in my reaction time measurements… I think it can take up to 1/60th of a second to update the graphics screen but I tried to keep the code as tight as possible)

Seems like an unlikely (and therefore interesting) finding.

If you could export the data in a CSV format then it would be easier to analyse any correlation. Just looking at graphs of averages can be misleading — human brains are tuned to notice patterns, after all, even if they’re not really there.

Importantly, even if the two are correlated, they might not be causally related. It could just be a coincidence. It’s also possible that some third factor is causal in both of them. E.g. time of year or diet.

If I were to hypothesise a connection between the two, then perhaps when you feel good about your body (because you’ve lost weight) you psychologically predispose yourself to faster reactions. Indeed, we suspect the inverse of that can occur – students primed with words associated with old age walked out of the experiment more slowly than the control group.

But that’s just conjecture on my part.

Interesting observation.
Keep us posted on any further analysis!

Luca

1 Like

This is a very intriguing graph. Am I understanding correctly that each data point is a monthly average and you’ve been tracking these two measures daily for about a year? I second @gianlucatruda’s request for a .csv file. Definitely surprising and interesting.

I was pretty sloppy in my data taking.

Here is the complete dataset:


Weight
8/23/18	5:48 AM	204	
8/11/18	8:35 AM	203.2	
7/19/18	6:45 AM	204.5	
7/8/18	10:12 AM	208	
6/30/18	6:42 AM	206.1	
6/28/18	10:44 AM	206.5	
6/23/18	7:16 AM	207.1	
6/14/18	5:45 AM	207.3	
6/8/18	3:23 AM	208	
5/20/18	4:26 AM	206.1	
5/19/18	5:14 PM	206.3	
5/17/18	6:32 AM	205.7	
5/13/18	6:18 AM	207.4	
5/3/18	1:09 PM	207.7	
4/23/18	3:32 AM	210	
4/18/18	5:33 AM	209.1	
4/2/18	3:52 AM	205.4	
4/1/18	5:18 AM	206	
3/31/18	6:01 AM	207.2	
3/26/18	7:38 AM	206.5	
3/18/18	7:03 AM	207.2	
3/11/18	9:01 AM	207.5	
3/8/18	6:52 AM	206.2	
3/1/18	8:24 AM	208	
2/22/18	4:32 AM	209	
2/21/18	8:24 AM	208	
2/11/18	11:06 AM	207.5	
2/11/18	3:48 AM	209.5	
2/9/18	4:50 AM	209.3	
2/7/18	3:23 AM	211	
2/4/18	6:57 PM	210	
1/31/18	3:26 AM	207.4	
1/28/18	2:11 PM	209	
1/16/18	8:46 AM	208	
1/12/18	6:56 AM	206	
1/10/18	4:38 AM	205	
1/7/18	4:29 AM	203	
12/31/17	9:59 AM	205	
12/8/17	2:45 PM	202	
12/7/17	12:09 PM	203	
12/5/17	6:01 AM	202.7	
12/3/17	8:25 AM	201	
12/3/17	2:31 AM	201.9	
11/28/17	10:44 AM	202.5	
11/27/17	4:56 AM	202.2	
11/26/17	5:33 AM	202.7	
11/23/17	8:11 AM	203	
11/22/17	9:35 AM	202.5	
11/22/17	4:52 AM	203.3	
11/20/17	6:24 AM	203.3	
11/13/17	1:32 AM	203.9	
11/13/17	1:10 AM	204.1	
11/12/17	5:52 AM	204.3	
11/6/17	3:19 AM	203.3	
11/4/17	5:49 AM	204.7	
11/1/17	10:25 AM	204	
10/26/17	4:54 AM	204.7	
10/19/17	6:41 AM	205	
10/17/17	7:15 AM	204.5	
10/16/17	9:44 AM	205.7	
10/14/17	7:37 AM	206.5	
10/12/17	5:57 PM	205.4	
10/9/17	7:06 AM	206.5	
10/9/17	5:50 AM	206.7	
9/27/17	12:40 PM	204.6	
9/23/17	6:25 AM	205	
9/14/17	7:38 AM	203.4	
9/13/17	5:37 AM	205.3	
9/12/17	6:31 AM	205.8	
9/11/17	6:04 AM	206	
9/10/17	8:00 AM	205.5	
9/7/17	11:12 AM	205	
9/3/17	6:08 AM	204.3	
9/2/17	7:15 AM	204.6	
8/17/17	6:54 AM	206.7	
8/15/17	6:50 AM	206.8	
8/7/17	8:18 AM	206.5	
8/3/17	6:56 AM	207.5	
8/3/17	4:55 AM	208.3	
8/2/17	10:26 AM	209	
7/26/17	3:35 AM	206.4	
7/23/17	5:02 AM	207.7	
7/16/17	6:07 AM	206.7	
7/13/17	6:31 AM	207	
7/10/17	6:33 AM	206.2	
7/5/17	6:32 AM	205.8	
7/4/17	7:46 AM	206	
7/3/17	7:31 AM	205.8	
7/2/17	5:09 AM	206.3	
6/14/17	9:01 PM	207.3	
6/13/17	1:01 PM	207.6	
6/6/17	7:40 AM	208.1	
5/26/17	12:02 PM	208.4	
5/16/17	8:35 AM	208.7	
5/4/17	6:34 AM	208.1	
5/3/17	7:44 AM	208.9	
4/23/17	5:03 AM	208.2	
4/22/17	6:59 AM	208	
4/19/17	11:09 PM	208.6	
4/9/17	7:39 AM	209.2	
4/7/17	8:08 AM	210.7	

Reaction Time
8/27/18	7:41 AM	251	
8/24/18	5:06 AM	250	
8/23/18	6:11 AM	253	
4/23/18	3:32 AM	269	
3/30/18	6:09 AM	248	
2/22/18	8:31 PM	281	
2/20/18	12:17 PM	265	
2/11/18	3:03 AM	255	
2/4/18	6:56 PM	242	
1/10/18	2:22 PM	251	
11/25/17	7:17 AM	241	
11/22/17	5:39 AM	260	
11/16/17	5:54 PM	267	
11/13/17	5:55 PM	256	
11/4/17	12:21 PM	259	
10/30/17	1:30 PM	252	
10/29/17	7:01 AM	281	
10/27/17	5:36 PM	270	
10/26/17	6:57 PM	268	
10/24/17	6:53 PM	277	
10/21/17	7:11 PM	255	
10/20/17	7:37 PM	258	
10/19/17	6:34 PM	261	
10/18/17	3:34 AM	272	
10/16/17	9:43 AM	275	
10/14/17	2:34 AM	269	
10/12/17	4:19 AM	262	
10/11/17	7:20 AM	260	
10/9/17	3:14 AM	249	
10/8/17	8:39 AM	246	
10/5/17	6:12 AM	255	
10/4/17	8:05 PM	256	
9/28/17	4:05 AM	260	
9/20/17	5:29 AM	265	
9/10/17	9:41 PM	266	
9/9/17	8:54 AM	266	
5/19/17	5:11 AM	270	
5/17/17	8:45 PM	257	
4/10/17	9:08 AM	268	
3/27/17	5:00 AM	267	
3/25/17	4:39 AM	276	
3/20/17	6:51 AM	280	
3/18/17	12:30 AM	275	
3/17/17	6:26 AM	283	
3/4/17	7:19 AM	263	
3/3/17	9:18 PM	284	
2/24/17	9:33 AM	274	
2/22/17	4:42 AM	260	
2/21/17	10:27 AM	262	
2/19/17	1:23 PM	263	
2/19/17	8:58 AM	265	
2/16/17	3:40 PM	266	
2/6/17	10:09 AM	258	
2/3/17	6:23 PM	262	
2/3/17	4:49 AM	265	
1/28/17	6:18 AM	266	
1/27/17	11:26 AM	256	
1/27/17	4:31 AM	270	
1/25/17	5:32 AM	265	
1/21/17	7:06 PM	270	
1/18/17	9:02 AM	275	
1/18/17	8:29 AM	277	

I would usually take my reaction time test trials until the average and median didnt fluctuate too much… in retrospect I should have used a fixed number of trials but each reaction test date reflects at least 10 attempts.

I would always log my reaction time results a minute or two after testings. My weight was usually recorded in the morning with just underwear on a digital scale after going to the bathroom.

I thought this was an interesting abstract about reaction time and mortality:

Do you track your sleep in any way? Poor sleep could explain both weight gain and lower reaction times…

Yes I use a Fitbit Alta. I seem to average about 6 hours a night which has quite a bit a room for improvement. I haven’t had my Fitbit long enough to track it over the winter months yet though but yes I definitely agree that lack of sleep dramatically influences my appetite.

Also I don’t snore as often when my body weight is lower so that greatly improves my sleep quality which certainly impacts my reaction time. I didn’t sleep well last night and my median reaction time is now about 300 msec so I am going to avoid driving the rest of day until I can at least get a nap.

1 Like