I currently use Symple on iphone, which is great, but it’s just a 0-5 scale. I try to mentally create meanings for each of the numbers, but it would be a lot more meaningful if I could write a description for each number. For example, for “sleepy”, 0 could be “feel wide awake”, 1 could be “not completely wide awake, but mental capacity is not affected”, 2 could be “mental abilities are slightly diminished or slower”, etc.
Does anyone know if this exists? It would be nice to have some pre-existing categories and the ability to add my own.
Symple is only made for tracking symptoms, but I use it to track other things like “sense of fulfillment” and “feeling energetic” as well. I currently have 29 active categories that I track.
While I could probably create my own app if it doesn’t already exist, it could be a huge undertaking depending on how it’s done (unless it’s an app-maker for the non-technical that does most of the work for you), especially since I’m in school and have a part-time job, and am taking online classes on top of that, and trying to read additional textbooks, and I’m certainly not going to drop out of school to do this, because this is only one facet of my fascination of collecting (and someday analyzing) data about my whole life. It’s my goal to become a Data Scientist (I’m currently employed as a Software Engineer).
it’s awesome! thank you so much!! Nomie is like the answer to the question I didn’t know how to ask! (i.e. you prevented me from making another post that would have been unnecessary.)
is there a list somewhere of awesome data-tracking apps, one which I would expect contains Nomie (and probably also my favorite iphone app aTimeLogger)?
another a particular thing I would like to track is my gps location. I would need to be able to download my gps history data so I can analyze it myself, and I would like enough data resolution in space and time to be able to detect the starting point and time length of an activity such as walking/running/biking/driving from/to home/office/etc. (e.g. it would be an issue if I have one data point at home and one data point at my office 40 minutes later, because I know my drive is about 20 minutes, so that data wouldn’t have enough resolution to tell when I started driving or when I arrived). ideally it would always be tracking so I wouldn’t have to worry about turning it on/off. I know Spot GPS has a similar tracking feature to this, but I’m not sure that users can download their own data for analysis, and since it’s geared towards off-grid personal safety, it’s pretty pricey. Waze doesn’t let me download my data, it’s pretty sad. and MileLogger only detects drives, not walking/running (though it might pick up bicycling, I haven’t tried it).
The Moves app (and Google Fit, if they ever add proper data export…) is a good option for tracking location 24/7 without draining your battery too much. It’s accurate enough to give you an idea when and how much time you spent at specific places (and doing certain activities), but not accurate enough to measure distances.
import gmaps
# explanation of how to get the api key is from the gmaps repository
gmaps.configure(api_key=API_KEY_GOES_HERE)
# this data is copy-pasted from the Moves app data export. the data
# should be put into and loaded from a file when it's not just a simple test
data = {"export":...}
# just extract the data to a list of points
locations = list()
for a in data['export']:
for b in a['segments']:
loc = b['place']['location']
locations.append((loc['lat'], loc['lon']))
# plot the data
m = gmaps.Map()
m.add_layer(gmaps.Heatmap(data=locations))
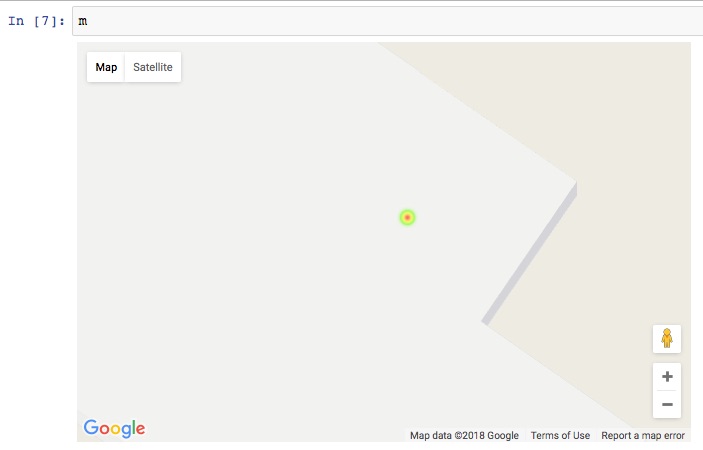
m
with one point, so far I have a blip on the map. in a few days after I’ve been moving/driving around, I’ll try it again and see if it’s enough data to suit my needs. Thanks again!
update 2018-01-13 6:41 PM
I learned of another map plotting python library that also works in jupyter, mplleaflet