Statistical findings

Hi,
since Gary told me I need to be more specific I am going to post my first significant findings.

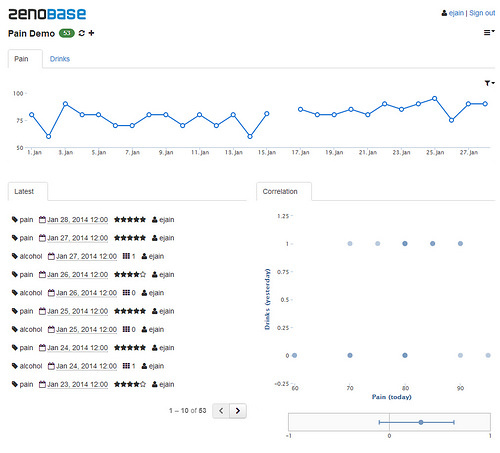
I recorded my pain on a scale from 0 to 1, like percentage.
I also recorded whether I drank alcohol on that day. And set up a variable whether I drank the day before

Model Summary (E_Painscale)
╔══════════╦════════╤═════════════════╤══════════════════════════╗
║ R-Quadrat║R Square│Adjusted R Square│Std. Error of the Estimate║
╠╤═════════╬════════╪═════════════════╪══════════════════════════╣
║│ ,45║ ,20│ ,13│ ,10║
╚╧═════════╩════════╧═════════════════╧══════════════════════════╝

ANOVA (E_Painscale)
╔═══════════╦══════════════╤══╤═══════════╤════╤════════════╗
║ ║Sum of Squares │df │ Mean Square│ F │ Significance║
╠╤══════════╬══════════════╪══╪═══════════╪════╪════════════╣
║│ Regression║ ,06│ 2│ ,03│2,74│ ,09║
║│ Residual ║ ,24│22│ ,01│ │ ║
║│ Total ║ ,30│24│ │ │ ║
╚╧══════════╩══════════════╧══╧═══════════╧════╧════════════╝

Coefficients (E_Painscale)
╔════════════╦════╤══════════╤════╤═════╤════════════╗
║ ║ B │Std. Error│Beta│ t │Significance║
╠╤═══════════╬════╪══════════╪════╪═════╪════════════╣
║│ (Constant) ║ ,18│ ,03│ ,00│ 6,82│ ,00║
║│ V_Alk ║-,10│ ,05│-,40│-2,12│ ,05║
║│ v_alkvortag║-,04│ ,05│-,16│ -,86│ ,40║
╚╧═══════════╩════╧══════════╧════╧═════╧════════════╝

I used PSPP and linear regression as method. I have now 27 records.

To me it looks interesting, that v_Alk, meaning alcohol consumption the same day, is more significant then alcohol the day before. Leading to the question whether I drink because of the pain? I would habe expected to have the pain the other day, so after drinking alcohol.

So what do you guys think? It that method here used correctly?

I also get a significance of 0.07 for alcohol and acid burning in my throat (how do you call that in english). This one is easy understandable.

I’ve made a box plot from my findings this represents the data “days without exercise” and days with exercise.

It’s not too significant but linear regression gives me p=0.09. So for just 1 month of collecting data. I think its worth doing more logging on this variable.
[attachment=159]

Statistical tests such as ANOVA have certain assumptions that your data probably doesn’t meet.

This blog post explains a more suitable method for quantifying differences.

Hi Eric,
I started my post within the newbie section and Garry told me you can not tell which types of statistics is to be used in advance. So your blog post shows me a different assumptions.
Thanks fro that. I will read further…

http://www.uccs.edu/lbecker/effect-size.html

Here is also a link to the topic you were writing about. Somewhere they have also some form on their site where you can just type in your numbers and it calculates the SDpooled.

You have an excel formula for that?

The blog post on the Measured Me blog shows how Excel can be used to calculate an effect size. Have you worked through that yet?

Hi Eric,
yes I tried that. But I get results lower then zero. Since I am measuring from 0 to 1 or 0 to 100% there shouldn’t be any negative results?!

But I have to reread it again. I was just on my way to work and had just few time.

I’ll make a post with my results, so you can check on them.

thanks for your help so far.

n 27 12 15
mean 0.799 10.083 12.667
stdev 0.0883 5.885 5.615

SD pooled	       6.23			
				
g	             0.3695			
				
confidence	       0.809			
lower bound	1.178			
upper boung	-0.439			

So these are my results.

I also tried to post my data, but it doesn’t display readable on here. I’ll attach my open office file

So perhaps you can check my results! are they OK?
For my data. I measured my “wellness” from 0 to 1.
Groups are Without exercise and with exercise.

In the box plots we see a difference and in the regression i found p=0.09.
I am not sure about your formulas. Why do I get lower bound with negative values?
But from your blog posts it looks like there is no significance.

I would be glad when you could review my calculations.
Thanks


Here come my file. But it doesn’t look to tidy :smiley:

The alpha for the CONFIDENCE function should probably be 0.05 (95%), not 0.5 (50%).

If the lower bound is negative, and the upper bound is positive (as appears to be the case here), then drinking alcohol could either reduce or increase pain.

Yes I found thatz error of the wrong alpha.
Thanks

I also followed the info about computing the effect sizes

In this case Cohen’s d ist 0.44. So it seems to have “medium” effect.

The large confidence interval suggests that you collect more data before reaching that conclusion :slight_smile:

btw you can do the same analysis on zenobase.com more conveniently:

upper bound 0.62 3.82
lower bound 0.51 -2.41
Confidence 0.06 3.12
Hege’s G 0.57 0.70
Cohen’s D 0.70 -0.73

N=31

So here comes my results again.
I did follow the tutorials this time I made it with and without ranking go the data.
The ranked data is on the right side.

I measured my wellbeing against sports.

You can see that the cohen’s d is in both calculations around 0.7. so we can estimate a medium effect.
So the major difference here is that with hedge’s g being low the interpretation of the significance is different.

while in the unranked data calculation we seem to have a significance (upper and lower bound are above 0) we don’t see this in the ranked data.

But I think when you always calculate cohen’s d you will still have an indicator for changes.
So the assumption that you may be better off using ranked data may not be true in every case!

The advantage of ranked data is that it is less sensitive to outliers; the drawback is that real correlations can end up being underestimated. So you’re right, there’s no single, simple method that works best in all cases (I wish there was)!

Today I thought about stress. The cortisol posting in the forum made me think.

So I tried testing my wellbeing against work days and sundays or days off.

So having opened my dental office just one year ago I am glad to tell you that Cohen’s d is at 0.06 with real data and 0.23 with ranked data.

So either I am the lazy guy or doing my business doesn’t bother me, at least in terms of my wellbeing.

So I will keep an eye on it. Perhaps it will change as business grows over time. At least I have some data to compare it to for the future.

So for now sports seems to have the greatest impact on my wellbeing.
I think I will make a complete list of cohen’s d values for my variables to share them with you.
I am also working on improving my excel sheet. So I’ll be able to share that, too.

Here comes the one month results.
I’ve to admit that I skipped noting my values for this month, but today I thought about compiling my data:

Tabelle Cohen’s D raw Cohen’s D ranked
Sports -0.39 -0.38
strength -0.60 -0.60
choco 0.50 0.40
nuts 0.72 0.58
Algen 0.04 0.11
Alc 0.35 0.37
Alc_day-1 0.05 -0.16
hollyday 0.18 0.19
coffee -0.33 -0.35
tea -0.36 -0.43
vitc 0.66 1.28

Here you see the cohen’s d values. I did them on my own excel sheet, and since ranked data was also suggested, I did both ranked and raw data.

As you can see, most of the time the ranked data doesn’t differ too much. Just with the vitamin c data we see a huge difference. I didn’t notice at first, since I looked on my raw data results. So vitamin C should have a huge impact.

So I took a look at the means and I realized that positive value mean decreased mean in wellness, so that means it’s bad.
While on the other hand negative values present an increased mean of wellness.

So when thinking of food allergies nuts makes sense, and alcohol also seems reasonable to decrease my wellness.
On the other hand it may seem obvious that any kind of sports and green tea or coffee may help improve my wellness. Why vit C has negative effect? I can’t tell you for now.

Since I am always comparing same day results, I am thinking of combining some days results and look for changes.

I am also thinking of changing my test variables. Since we see that the consumption of sea weed (Alge) doesn’t have any effect. And so did dairy products, which I feared my have a negative effect.

So these are my results for the first month.
I am looking forward to your comments.

Cheers,

Jochen