Puzzle # 1.
Lets say I have two events that only ever happened once. So think of two flat graphs with one bump each representing, oh, “rock kicked at this moment” and “pain of toe”. Pretend we do not know that the one causes the other. How close must the bumps be in how long a time measured and empty for them to be probably causally related and interesting to a QSer? A book passage would probably be better than an answer.
Only ever happened once? Not enough information as it could just be due to randomness.
1 Like
Any correlation COULD be due to randomness but how unlikely must it be to be worth pointing out?
3 Likes
puzzel 1.b; Do 2 events of type one (doing jumping jax on Monday and Wensday) cause second two events of a second type shortly thereafter (knee pain on Thursday and Saturday).
1.c What if event A causes event B but always exactly after 72 hours? I mean detecting this is not too hard but is it worth while or will all those found be spurious correlations? Things like this are worth looking for as a matter of debugging the data. EDIT: I mean at least twice + - say 20 minutes.
With a statistical analysis approach, you could gather several months of data and perform a regression analysis to calculate to what degree event A is able to predict event B. However, you would you need enough samples to be confident the relationships wasn’t due to randomness.
With a machine learning approach, you could gather enough data to split it into train/test sets. Then you could train a model and see how well it performs on the test set. However, small data sets could lead to overfitting and a model that doesn’t generalize patterns well enough to make good predictions on real world data.
Neither one can determine causation.
Personally, I like the machine learning approach because it can handle large amounts of variables and deal with multicollinearity. So you could track 100 different variables for a year (all your activities, supplements, sleep, etc) and then plug it into a machine learning model to make predictions on some complex issue you may be facing, like back pain.
How would you bin the lag? Also the 1.c illustrates the need to have some bias?priors about how the world works. Time series plus RCT would be as close to establishing causality as stats can get but the RCT is up to the user.
Consider two large humps over several measurements and clearly significant events in two different time series variables . How close in time must they be to be worth mentioning as correlated to you the QSr.
@rain8dome9 I’m going to take this as a survey type question and answer it very literally. I’m mostly interested in connections between events separated by hours and days, but not by weeks or months. I don’t have a a well thought out theory to defend this interest, but I suspect is a combination of my knowledge of/assumptions about physiology and psychology, and the limitations of my analytical capacity. An approach that revealed connections on larger time scales would doubtless be interest me if it were explained—taught, really—but at the moment it’s not something I pay attention to.
That is a big part of what I hope to get out of this thread. Also to find a statistician and find out what statistical relationships the average QSer has found.
Why would the average user not naturally notice connections separated over a few hours? A few days or even a day I feel I forget.
Are you aware of the concept of p_value? It describes the probability, that a correlation between observations of random variables is based on chance alone. Its exact calculation depends on the method used to determine the correlation, but in general has the characteristic, that it decreases as the number of samples increases.
In statistical experiments it is common to set a p-value of 0.05 as threshold to accept the result as statistically significant, i.e. there is a 5% probability, that the derived correlation was based on chance.
Basic correlation almost never works on 2 time series. B/c lag, unit-root, sampling times. And many of my questions are about too few data points for correlation. Your tone implies I am dumb. You are dumb not me. Spurious Correlations are more because of bad use of time series than false discover rates and multiple comparison corrections. The only tests Google suggests for “time series” is autoregressive.
You are right that I do notice events that are only separated by a few hours. I notice them even without tracking, and they give me (some of) my hypotheses. The problem for me comes with the next steps. Right now what I do is: just look at my time series data. This can add confidence that my guesses are correct, or raise doubts. For instance, here is a test of whether my new medication approach helped:
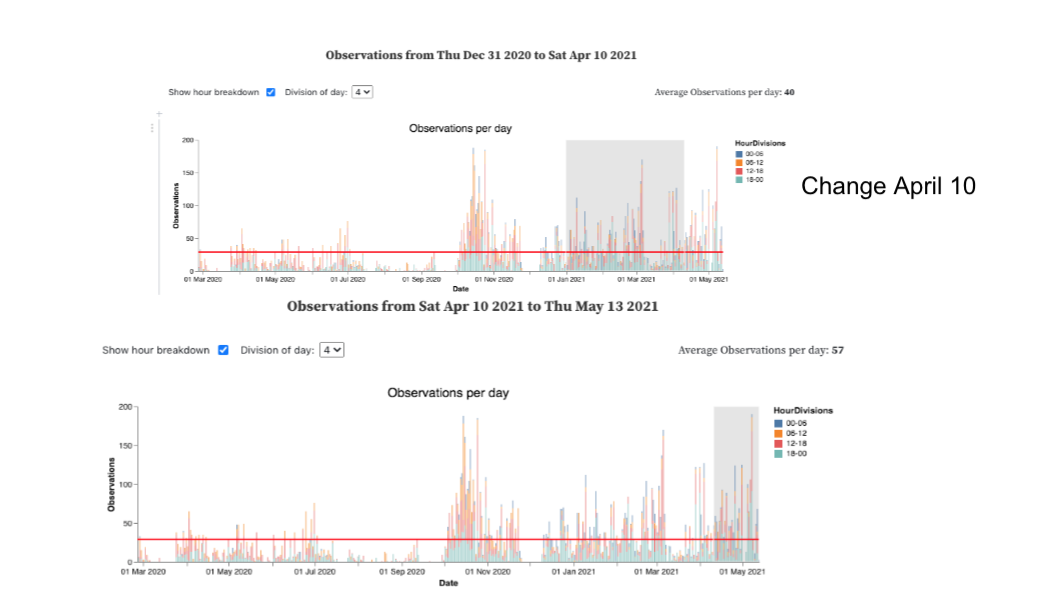
From casual observation/guessing, I would have said that my new medication was helping a bit. But my data raises doubts. The overage number of daily observations of arrhythmia events is actually higher under the new regimen.
So far so good. But here’s where the “horizon” of my ability lies. There are some other factors to consider. For instance, one of the reasons for switching to the new medication approach was that I didn’t like the side effects. So, after April 10, I stopped taking the slow acting form of the drug on a regular 2x daily schedule, and started taking the fast acting form of the drug whenever my arrhythmias were especially bad. Therefore, my data doesn’t show simply that my new medication approach is “worse.” It probably shows some kind of tradeoff: I take much less medication under the new regimen, at the cost of somewhat worse symptoms.
What I would like to do next is fine tune this tradeoff. Can I take a bit more medication, avoid the worst side effects, and bring the symptoms down? Also, I have a question about rebound effects: I suspect that being on a regular pattern of medication makes me vulnerable to worse events as my medication wears off. I suspect this because when I was on the 2x daily dose, I could use my worsening arrhythmias as a notification to take the next dose. If I forgot to take it on time, I would often feel suddenly worse.
These questions seem answerable using the kind of data I’m gathering. But my reasoning ability does not easily handle these next steps. I could probably come up with a design—actually I know I could. But it’s going to be a bit complex, and I’ve got lots of other things going on, so I’ve been stopped at this point for some time.
Again, I’m replying to your query as if I am a research subject, thinking that’s probably the most useful. I don’t want to start throwing solutions out there, because although I can think of plausible approaches, the fact that I haven’t actually implemented them in my own, fairly pressing case, suggests that my so called solutions would probably be fantasies.
My raw materials are: 1. An excellent set of time series observations of my arrhythmia episodes. I’m highly confident that these are accurate. 2. A project diary marking changes and interventions, such as medication doses and timings.
What more can I learn from these?
(Also, I could add another set of observations, but I like to do this with a realistic intention in mind.)
1 Like
I don’t know whether anyone here will find this interesting, but I came across this pre-print that addresses some big picture challenges and approaches to analyzing “Life Science” data. At least some of what they discuss is relevant in the QS world. It’s quite technical, which may be a turn-off for some. Anyways, part of the problem is that living things are ridiculously complicated systems with more inputs and outputs (and feedback and crosstalk) than we can measure, so we have to make some simplifying assumptions and generally form a conceptual model. Also, we always have to be careful to remember that correlation MAY imply causation, but often does not, and it takes a whole lot of evidence to build a compelling case that you’ve found such a thing.
Section 3 of the paper shows a decision tree that you can use to determine which of the four major classes of problems you’re trying to address, so you can read further on the ways researchers typically approach that class of problem.
Disclaimer: I have no personal connection to this paper, but I hope some of you might get some value from looking it over.
Mar 2020 to May 2021. big increase after October 2020. Quick drop in December. Drop in March and rise in April. April 10th new regimen.
Effect of (type, time and dose) of medication on symptoms and side effects. Effect of longer term use of medication on severity of effects/rebounding.
First thought. Every arrhythmia bin as observation data point for a Statistical Learning algorithm like Random Forest or MARS. Predictors made by quantity and type of medication binned into intervals, which increase as they move back in time.
So this should work well enough on shortish term effects. The result you want is the variable importance and its ICE plot. Then heatmap with value on X, lag on Y and effect on Z.
Problems. First, that does not determine exact lag, and as a consequence, does not determine dose as close as needed. It is possible to use the most predictive intervals, but I do not know how to regularize for that aside from validation and test sets and I do not think I have ever seen it used. Regarding validation and test sets in SL, since you are using the new type of medicine getting the proper ‘always later’ validation would make a very imbalanced test set. Exist plenty of regularized SL methods though so long as they are not too harmed by collinearity. Ex. Conditional Inference Trees.
More problems; As people use medication it may loose potency or problem may change and that is not accounted for in the model unless time is added as a predictor and to the heatmap somehow… animate the heatmap!
Even more problems! I do not think that time series of yours is stationary so either include binned previous arrhythmia as a predictor or get a derivative of some kind.
Repeat for short term effects on side effects.
Never actually done a lot of this so feel free to correct me if you have.