Wow, this could be really useful. I’ll have to get a cheap android phone, so first I’l run some trials on a friends phone.
1 Like
Today’s measurements:
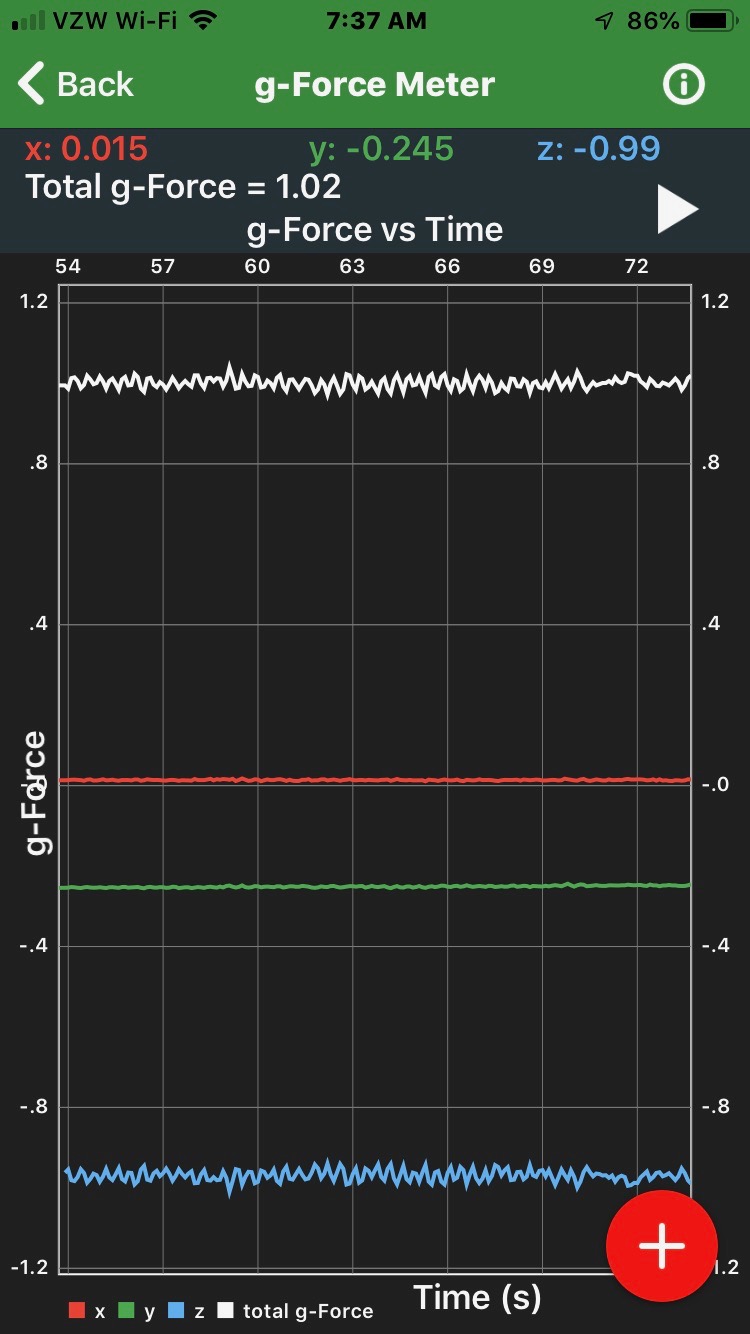
sensor-3-1.csv (213.3 KB)
One interesting thing from today is that the steadiness around 70 seconds is not an artifact. I noticed that for a moment my tremor went down. I was actually startled to feel it. One thing that happened at this moment is that I looked away from the phone. As soon as I looked away, the tremor dropped, and then, as I felt it, I looked back at the graph and could see the change. However, then it went back to “normal.” I was at this point in my wind down process and so I didn’t continue, so I’m not sure if it’s anything repeatable.
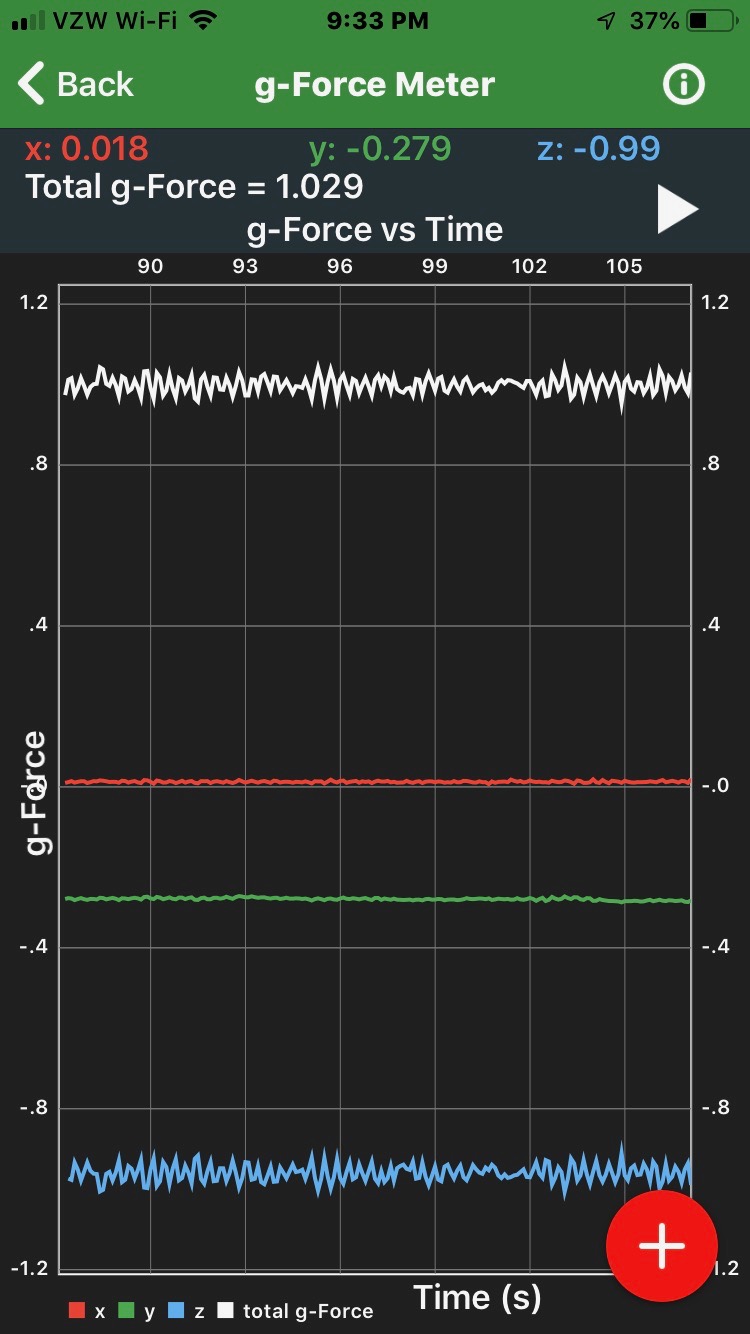
After lunch and a cup of coffee:

sensor-4.csv (384.4 KB)
Extra long data file this time to help with analysis.
SensorRecord can set recording interval to 10ms. That seems much better than PTS.
PTS is able to show the tremor pretty clearly. Would better resolution show something different, or have other advantages? If I were competent in this area the answer might be obvious, but I’m not, so I don’t know the benefit.
1 Like
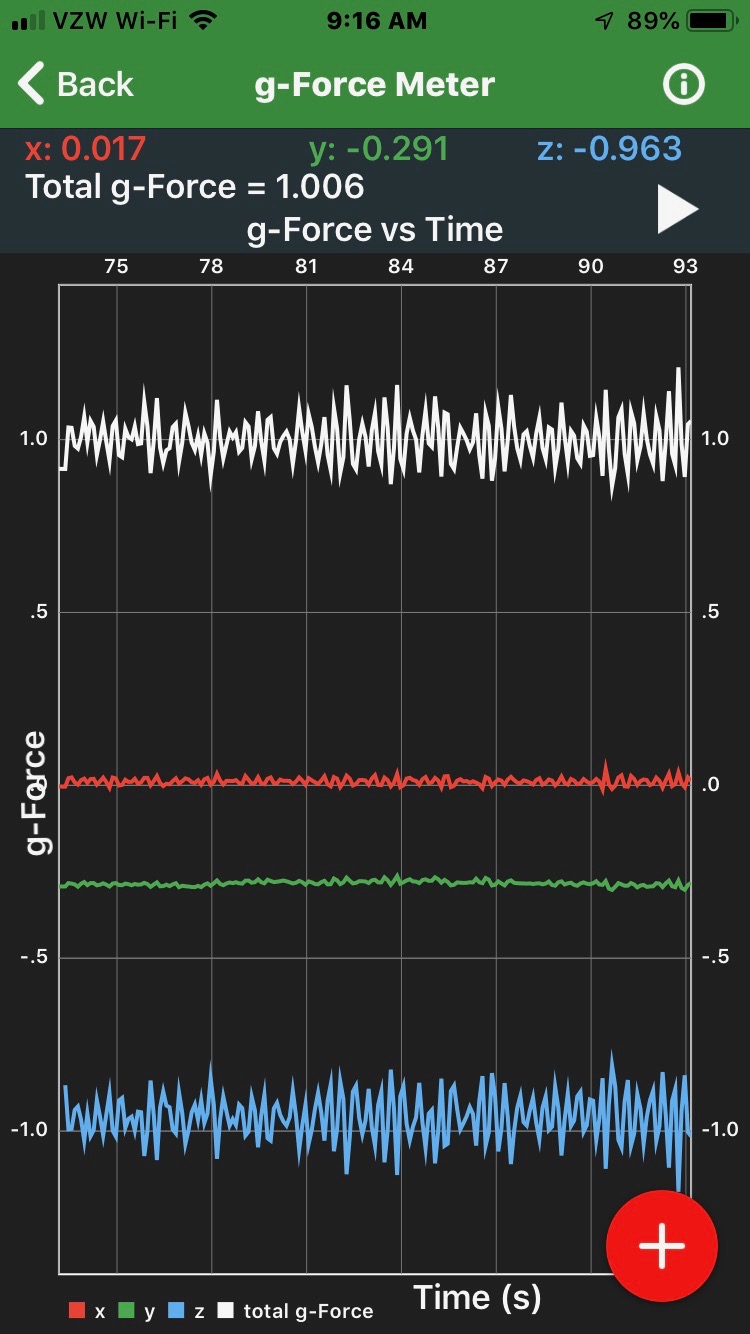
Tremor extra annoying today, but on the graph just regular level of annoying is visible. Not sure what causes the extra annoyance, but suspect it may be in the “ease of induction” of the tremor. Remember that my measurements are made using a hand position that I know will induce the tremor. SO this is measuring: “when the tremor appears, how strong is it?”
The question: “When does the tremor appear” is a different question, but also personally relevant. Today the tremor is showing up a lot, including in relatively gross motor actions such as removing my glasses. But when measured, it doesn’t seem to be stronger than a regular “annoying tremor.”

sensor-2.csv (353.3 KB)
Will detect higher Hz vibrations. up to 100Hz. Could be a second hill in Beau_Gunderson 's FFT graph. Possibly hill is at 5 Hz because your current app only samples 5 times per second. More likely 10 times.
the data is interpolated (necessary for feeding uniformly spaced data to the FFT) so my guess is it’s pretty accurate right now—I plan on running all of the newer files through when I get a chance though, and of course it would be nice to compare a 10hz sample just to see how it differs
100hz. you are using 10 Hz I think
I ordered a cheap Android phone to try out SensorRecord - should arrive Friday…
1 Like
I’ve been wondering: is my tremor worse when heart rate and blood pressure higher? Tremor is sometimes treated with beta-blockers, which are also used to treat high blood pressure.
From essentialtremor.org
Beta-blockers, also known as Beta-adrenergic blockers, beta-blockers are a class of drugs that block beta receptors in the brain. Beta-blockers decrease the effect of the sympathetic part of the autonomic nervousbsystem and are commonly used to reduce high blood pressure and treat migraine. They can also suppress tremors in many patients with ET. There are several types of beta receptors. It is thought that the development of drugs that could act specifically on individual beta receptors would lead to more effective tremor control. Propranolol (Inderal®) is a beta-blocking drug.
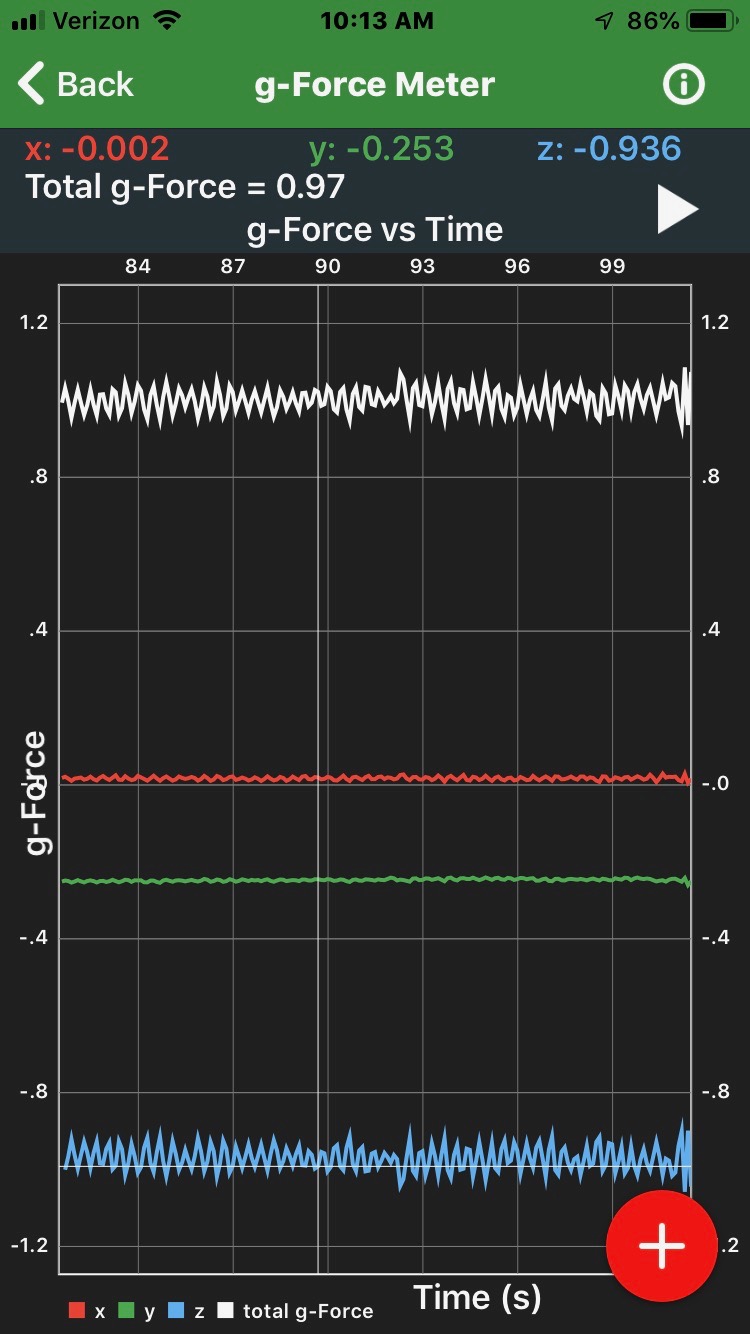
So, is my tremor worse when my heart rate is high? Tonight I did not feel very tremory, so I wanted to check with the g-Force sensor, and so I did the test right after measuring my blood pressure and heart rate. The three BP/HR measures are below. My median BP/HR in the last 30 days 128/80/64. Here BP is normal (for me), while pulse is higher.
132/82/78
128/81/77
125/85/77
HR is probably high because I recently got back from coaching my daughter’s soccer team, which is always a lot of exercise.
Tremor, on the other hand, appears to be somewhat low, which is what I’d guessed.
sensor.csv (341.4 KB)
I did some more reading on beta-blockers and tremor, and at least one recent source explains that the mechanism of action of Propranolol in reducing tremor isn’t through lowering heart rate and blood pressure, but through interfering with “effects of peripheral noncardiac beta-2 receptors located in the muscle spindles.” (See Pharmacotherapy of Essential Tremor by Peter Hedera, František Cibulčík, and Thomas L. Davis
So the BP/HR and essential tremor idea may be unproductive.
Nice papers! Indeed, it would seem like HR/BP and tremor are both affected by adrenaline (/epinephrine), and that is why they’re both affected by beta-blockers - which work by inhibiting the effects of adrenaline.
From the same paper (Pharmacotherapy of Essential Tremor by Peter Hedera, František Cibulčík, and Thomas L. Davis’): ‘Epinephrine upregulates the sensitivity of muscle spindles, leading to increased rhythmic afferent activity and, thus, higher synchronization of afferent signals and enhanced reflex activity.’
Thank you Valeria. I think what you’re suggesting is that upstream causes can influence both HR/BP and tremor, and therefore we might expect them to vary together. That makes sense to me.
Also, an “epistemological” conclusion from looking at the scientific literature on tremor is that I’m unlikely to understand it deeply enough to learn how to influence my own tremor. Just as it’s perhaps possible to master the coding skills to develop my own app for tremor measurement, it’s theoretically possible for me to make a discovery in the physiology of tremor - but it’s not practically possible in either case. Instead, I’m better off making (as simple as possible) measurements of what’s actually occurring, and tinker with the problem directly.
I’m still curious about BP/HR so I decided to keep exploring.
Pre-measurement predictions: 130/80,70; Tremory:4
Measurement result: AVG: 139/82,68 Tremor:4/5
(Actual measurements: 129/89,68 | 144/77,68 | 145/80,69)
Tremor measurement:
sensor-1.csv (262.3 KB)
I define tremory as: a feeling of vulnerability to tremor that is noticeable in daily activities without intentionally inducing the measurement tremor.
- very low tremory
- somewhat low tremory
- typical tremory
- somewhat high tremory
- very high tremory
However, I do not have this level of precision in my measurement, since I’m just eyeballing the graph. In this measurement, there is clearly somewhat high tremor, but I don’t have an objective definition of the difference between somewhat and very high. I hope to get some help from a friend in scoring my data so I can have a 5 pt tremor score.
Prediction: 130/80,70, Tremory: 2
Measurement: AVG: 128/73,68 Tremor: 3
(Actual measurements:141/86, 67 | 117/68, 66 | 125/69, 66)

sensor-2.csv (301.7 KB)
This is a case where my estimate of tremory is off. I was more tremory than I thought.
@Beau_Gunderson can you share the notebook you’re using? @madprime is helping me think about this and says it would be useful.
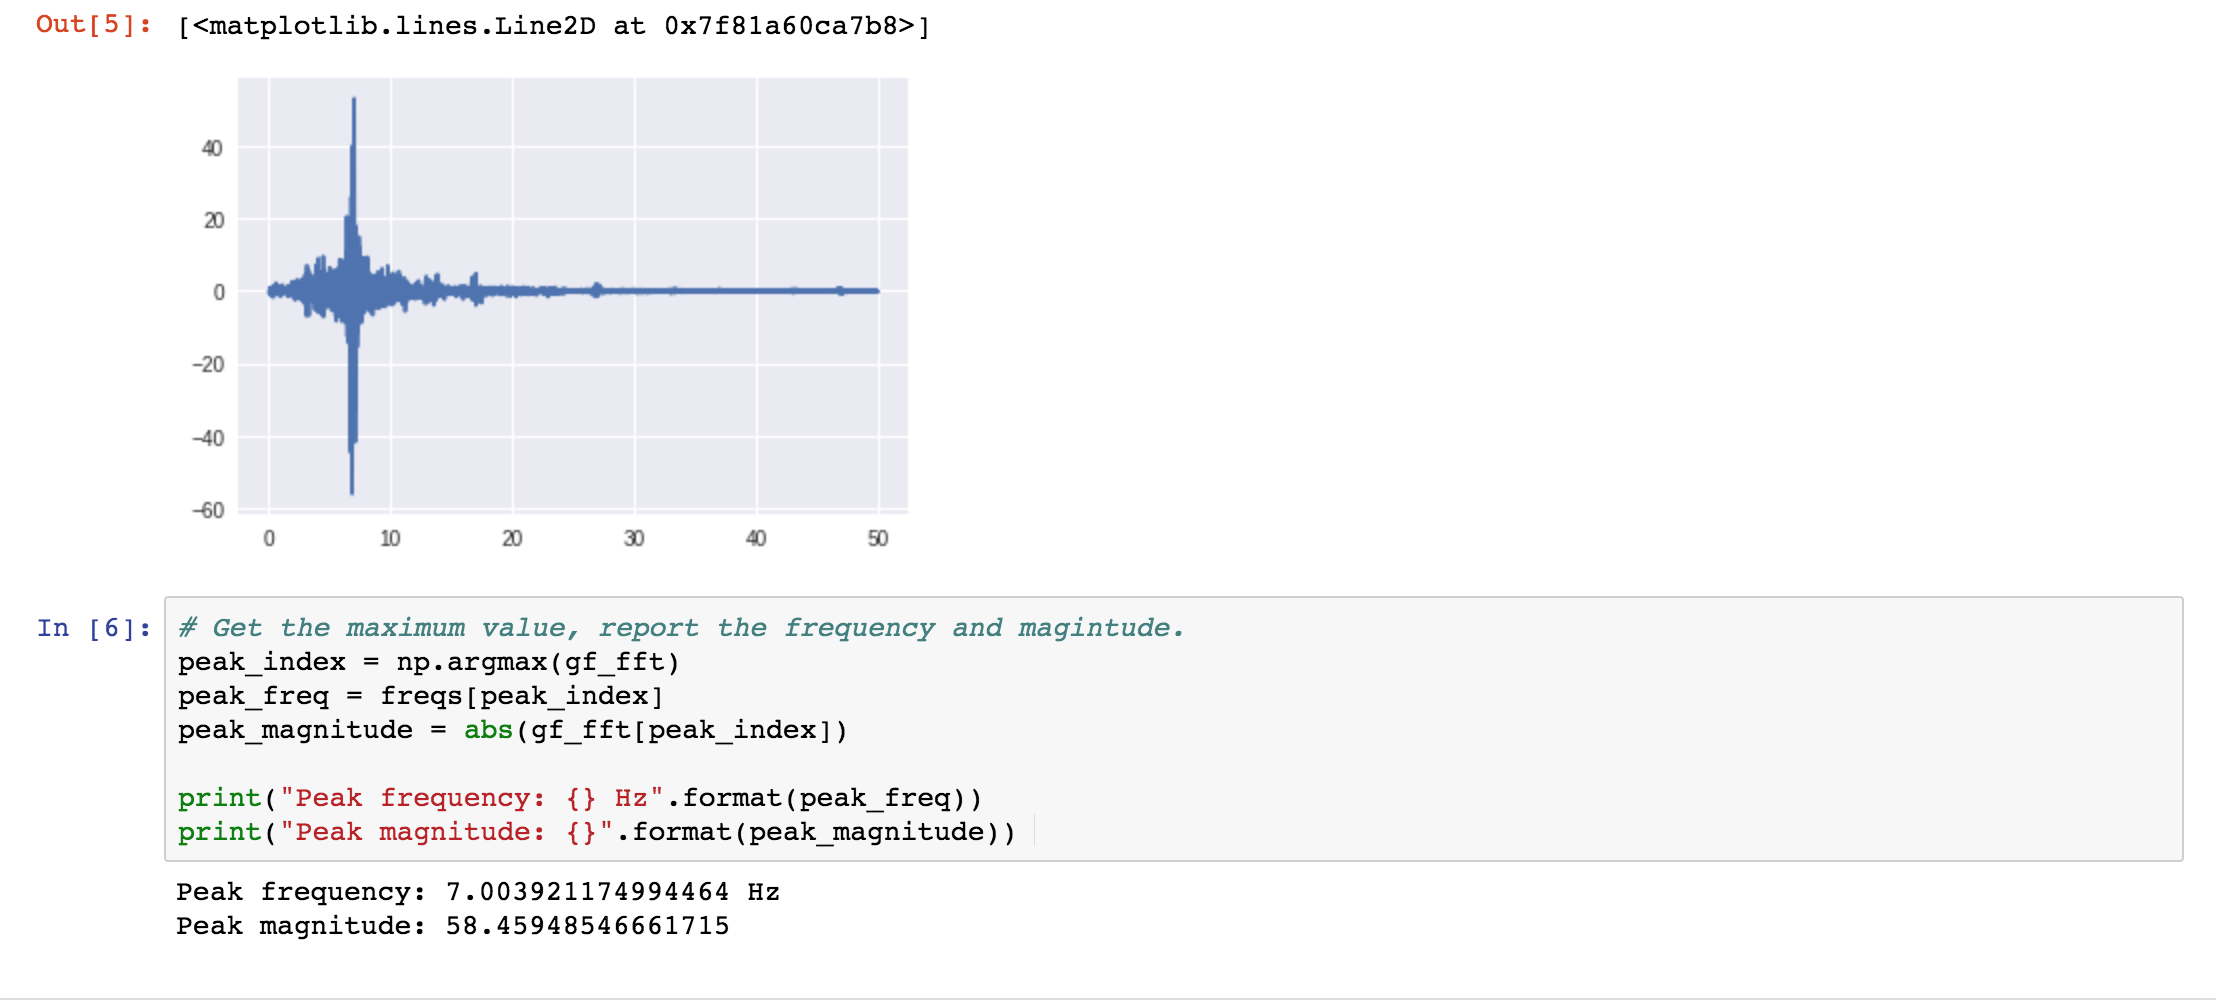
@Agaricus I think I’ve reproduced this (much thanks to the screenshot and slack responses from @Beau_Gunderson). I tried adding an additional measure I think you wanted – reporting the peak frequency and the magnitude at that peak.
20190829 MPB tremor analysis.ipynb (14.1 KB)
I can help walk you through running this if you’d like. It’s a manually uploaded file, so Open Humans doesn’t provide any OH-specific value for this (yet), but does give you a standardized personal Jupyter instance. 
Thank you @madprime! OK, now I have to install Python. How hard can it be?
I didn’t make predictions this morning or have a chance to to make my regular measurements before coffee and food,=, but during our “quantified heart” PLR decided to measure: so this one is an “at work” measurement.
Measurement: AVG: 142/88, 58 Tremor: 3
(Actual measurements: 136/85, 57 | 149/87, 58 | 142/92, 58)
201908301016.csv (504.5 KB)
@madprime messaged me to point out that I didn’t need to install anything, I could just use Open Humans. Right!
I signed into Open Humans, uploaded the file, and could see the output. Peak magnitude is 58.5. I’ll have to work with this a bit and see how it goes.
:
1 Like