I’m curious how different factors such as sleep and nutrition help with recovery after intense aerobic exercise. The exercise consists of short HIIT sessions on an elliptical trainer or exercise bike twice a week, and weekly hikes (with large variations in duration and intensity).
For starters, I figure I need to be able to measure:
How much I exerted myself, and
How well recovered I am on any given day.
To measure exertion, tracking heart rate seems like the obvious thing to do. What’s less obvious is what metric to use; TRIMPexp, an exponential scaling of relative heart rate multiplied by time, seems like a good candidate.
HRV is supposed to be a useful metric for recovery, but I haven’t had much success with it in the past: Camera-based readings weren’t consistent enough, chest straps wouldn’t work unless I smeared myself with electrode gel every morning (no thank you), and in any case readings seemed to reflect my breathing rate more than anything else. Could have another go with a latest-generation optical heart rate monitor, and an app that supports paced breathing.
Given your interests, have you considered Whoop? I haven’t tried it yet, but I’ve been listening to the Whoop podcast. The founder talks a real good story, and has some very elite athletes on board. You wear it 24 x 7 (which is not what everybody wants), but it measures sleep and exertion, and it sounds like it gives you nice analytics regarding your recovery. Listeners also get a discount code for $30 off.
Haven’t found wrist-worn heart-rate monitors to be accurate enough to track heart rate during exercise, or to track sleep. Meanwhile HRV is so fickle that I need to go through the exact same process every day in order to get reproducible results. It’s possible that Whoop got all this all figured out, but I couldn’t find any specifics on their website…
I had hoped that the readings would be sensitive enough to reflect days I went to the gym, went hiking, or staid at home, but that’s not the case. On the one day with the significantly lower reading I was perfectly fine, but had gotten up (and taken the reading) one hour earlier than usual; this demonstrates how you need to be consistent if you want to get any use out of such data!
I’m still optimistic that I can track 1. trends over longer periods of time, and 2. the impact of exerting myself significantly more than I’m used to (TBD ).
Some notes on doing HRV readings with the Elite HRV app and a Scosche Rhythm24:
Elite HRV can’t find the Scosche Rhythm24 unless I briefly open the Rhythm Sync app first (without connecting to the device).
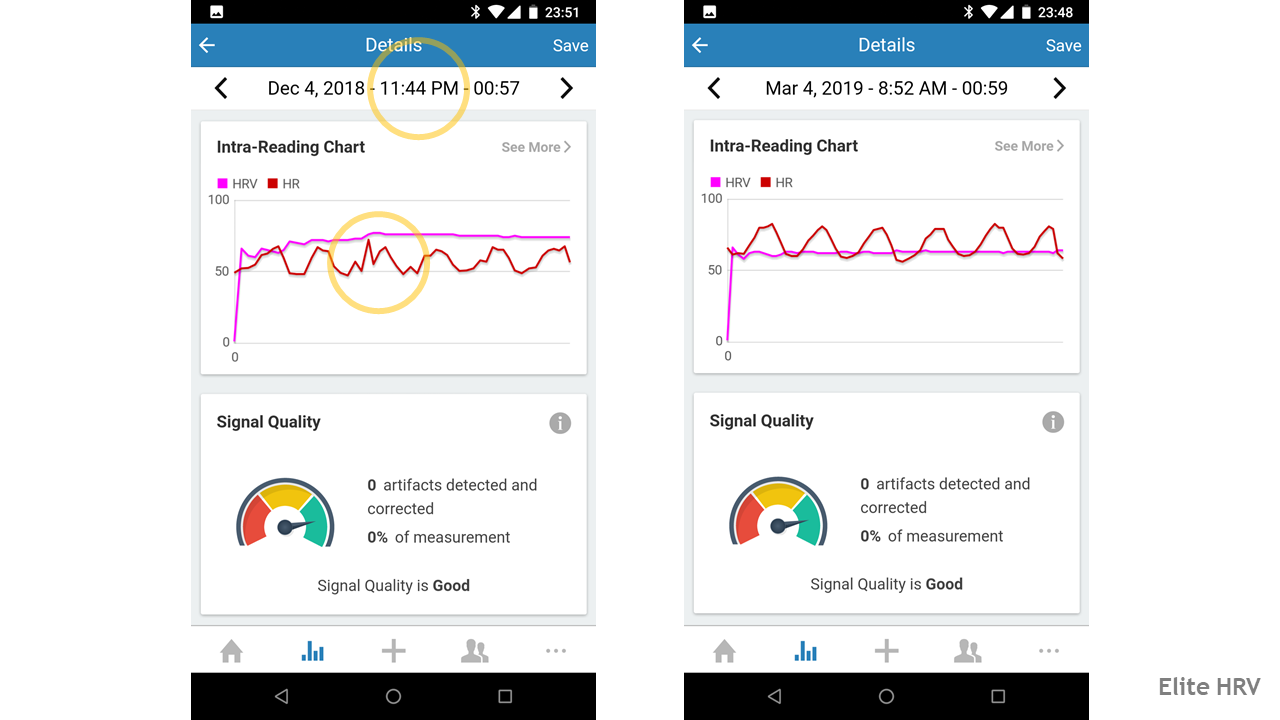
It is possible to get readings that are too high even when the app claims that no artifacts were detected and that the signal quality was good (the HRV4Training app has the same issue). The problem is obvious when looking at the RR-interval chart (which should look like rolling hills, not jagged peaks, see the screenshots below).
To get good readings, the strap should be tight on the lower arm, the arm should rest on a hard surface, out of direct sunlight, and covered with a dark piece of cloth (if not wearing long sleeves).
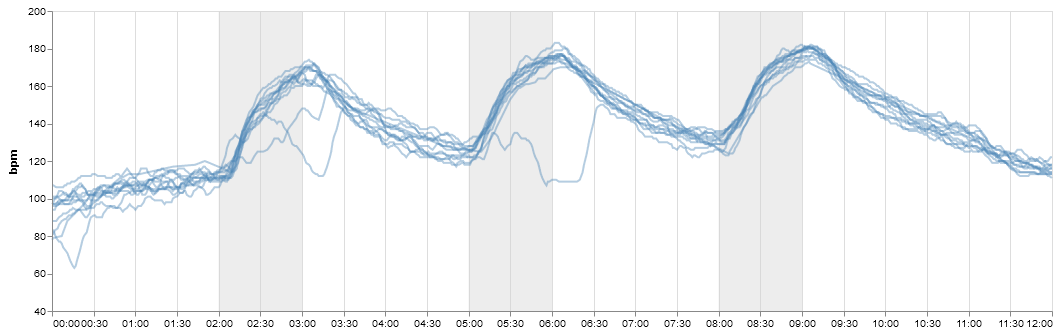
Here are a few exercise bike sessions, recorded over several weeks with a Scosche Rhythm24 and the myWorkouts app. The gray intervals are where I’m supposed to exert myself to the maximum. The outliers are bad data from before I figured out that I’m better off wearing the sensor on the upper arm rather than on the forearm. Looks like the sensor will rather report a too low heart rate than admit defeat…
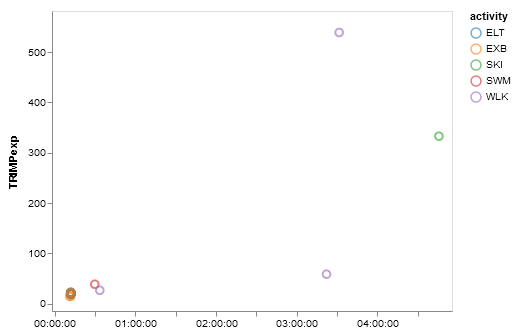
Here are TRIMPexp scores for a few different activities (ELT=elliptical trainer, EXB=exercise bike, SKI=skiing, SWM=lap swimming, WLK=hiking), plotted by duration.
Elliptical trainer or exercise bike sessions would have been ideal for comparing the effects of different routines on recovery as they can be done regularly, and in a more or less controlled environment.
Unfortunately, activities with a score of less than 500 don’t seem to have a measurable impact on the next day’s HRV, which is how I was going to measure recovery. Activities with a score above 100 may have a cumulative effect if done daily (not happening), and activities with a score of 500+ are infrequent (once or twice a month), and not very controlled (i.e. I’m not repeating the exact same hike multiple times under similar conditions).
Nevertheless, I’ll keep tracking heart rate while hiking, as well as doing daily HRV measurements throughout this summer
Just got to do an activity with a score of almost 900 (which is about as far as I’ll go), and did not see an impact on HRV during the following days, despite being in obvious need of some recovery time…
Here are the HRV readings I have taken this year: The values are based on the RMSSD, normalized on a log scale to a 0-100 score. Outliers are marked red. The line is the 7-day moving average, and the background shading is the activity level for the day (based on step counts), with darker being more active.
High outliers are mostly bad readings (I suspect), and only one of the low outliers corresponded with anything obvious (sore throat).
If there is a signal in that data that reflects exercise “readiness”, it’s clearly being masked by day-to-day noise (caused by a not perfectly regular sleeping schedule and other factors).
Still holding some hope for long-term trends or seasonal patterns…
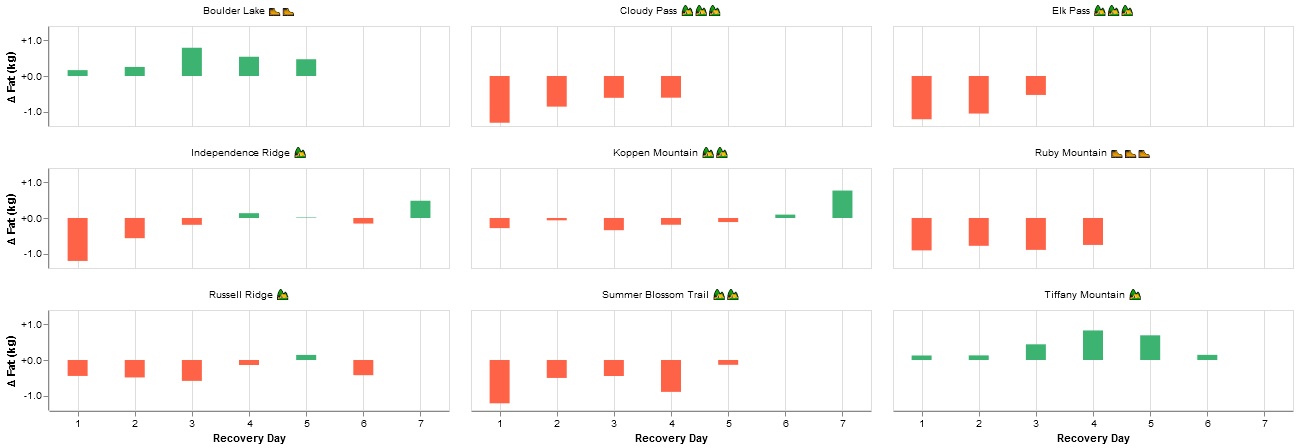
Here’s an alternative approach: Tracking how many days it takes for my body fat (or whatever it is the Withings scale measures…) to recover to its previous level.
Neither my diet nor my sleep nor my exercise during the “recovery” periods are consistent, so there is indeed too much noise to see any clear effects except in extreme cases (see chart), and those extreme cases are too few and too unique to support much experimentation.
I guess I’ll just post the code here… The code is very much custom and one-off, but some of it (like the TRIMPexp calculation, or the charts) may be copy-pasteable.
Have you looked into using the Polar H10 + HRV Logger to track your HRV? I have been using that stack for a few months and now want to start analyzing the data to see if I find any interesting findings.
As mentioned in the first post, chest straps didn’t work well for me (Polar H7). Used HRV4Training for a while (HRV Logger wasn’t available on Android) before switching to Elite HRV (paced breathing, multiple recordings per day).
Please share if you find anything in your data, or also if you don’t
Will def share! I just got 2 months of R-R intervals into a giant dataframe in Pandas now computing HRV.
Sorry if Im beating a dead horse but Im not smearing electrode gel on my chest strap and seems to be working fine…have you tried without and the only way you get readings is with gel? Just trying to make sure Im getting good data.
That was my conclusion. Even had the straps replaced, just to be sure. But this will depend on how dry/oily/sweaty/hairy your skin is. Should be obvious if the data is bad (gaps in the data, or noise like in one of the two Elite HRV screenshots above).

 ).
).

 easy hike,
  backpacking