I edited my previous post. I parse the data. Its not quick and easy to do. If you track a lot of things over a long time though parsing is much less effort.
I am always of the opinion that you use what works for you no matter what friends might do. If their scheme is an improvement over yours then adopt it and change your data accordingly. But just because someone else does it different does not mean you have to.
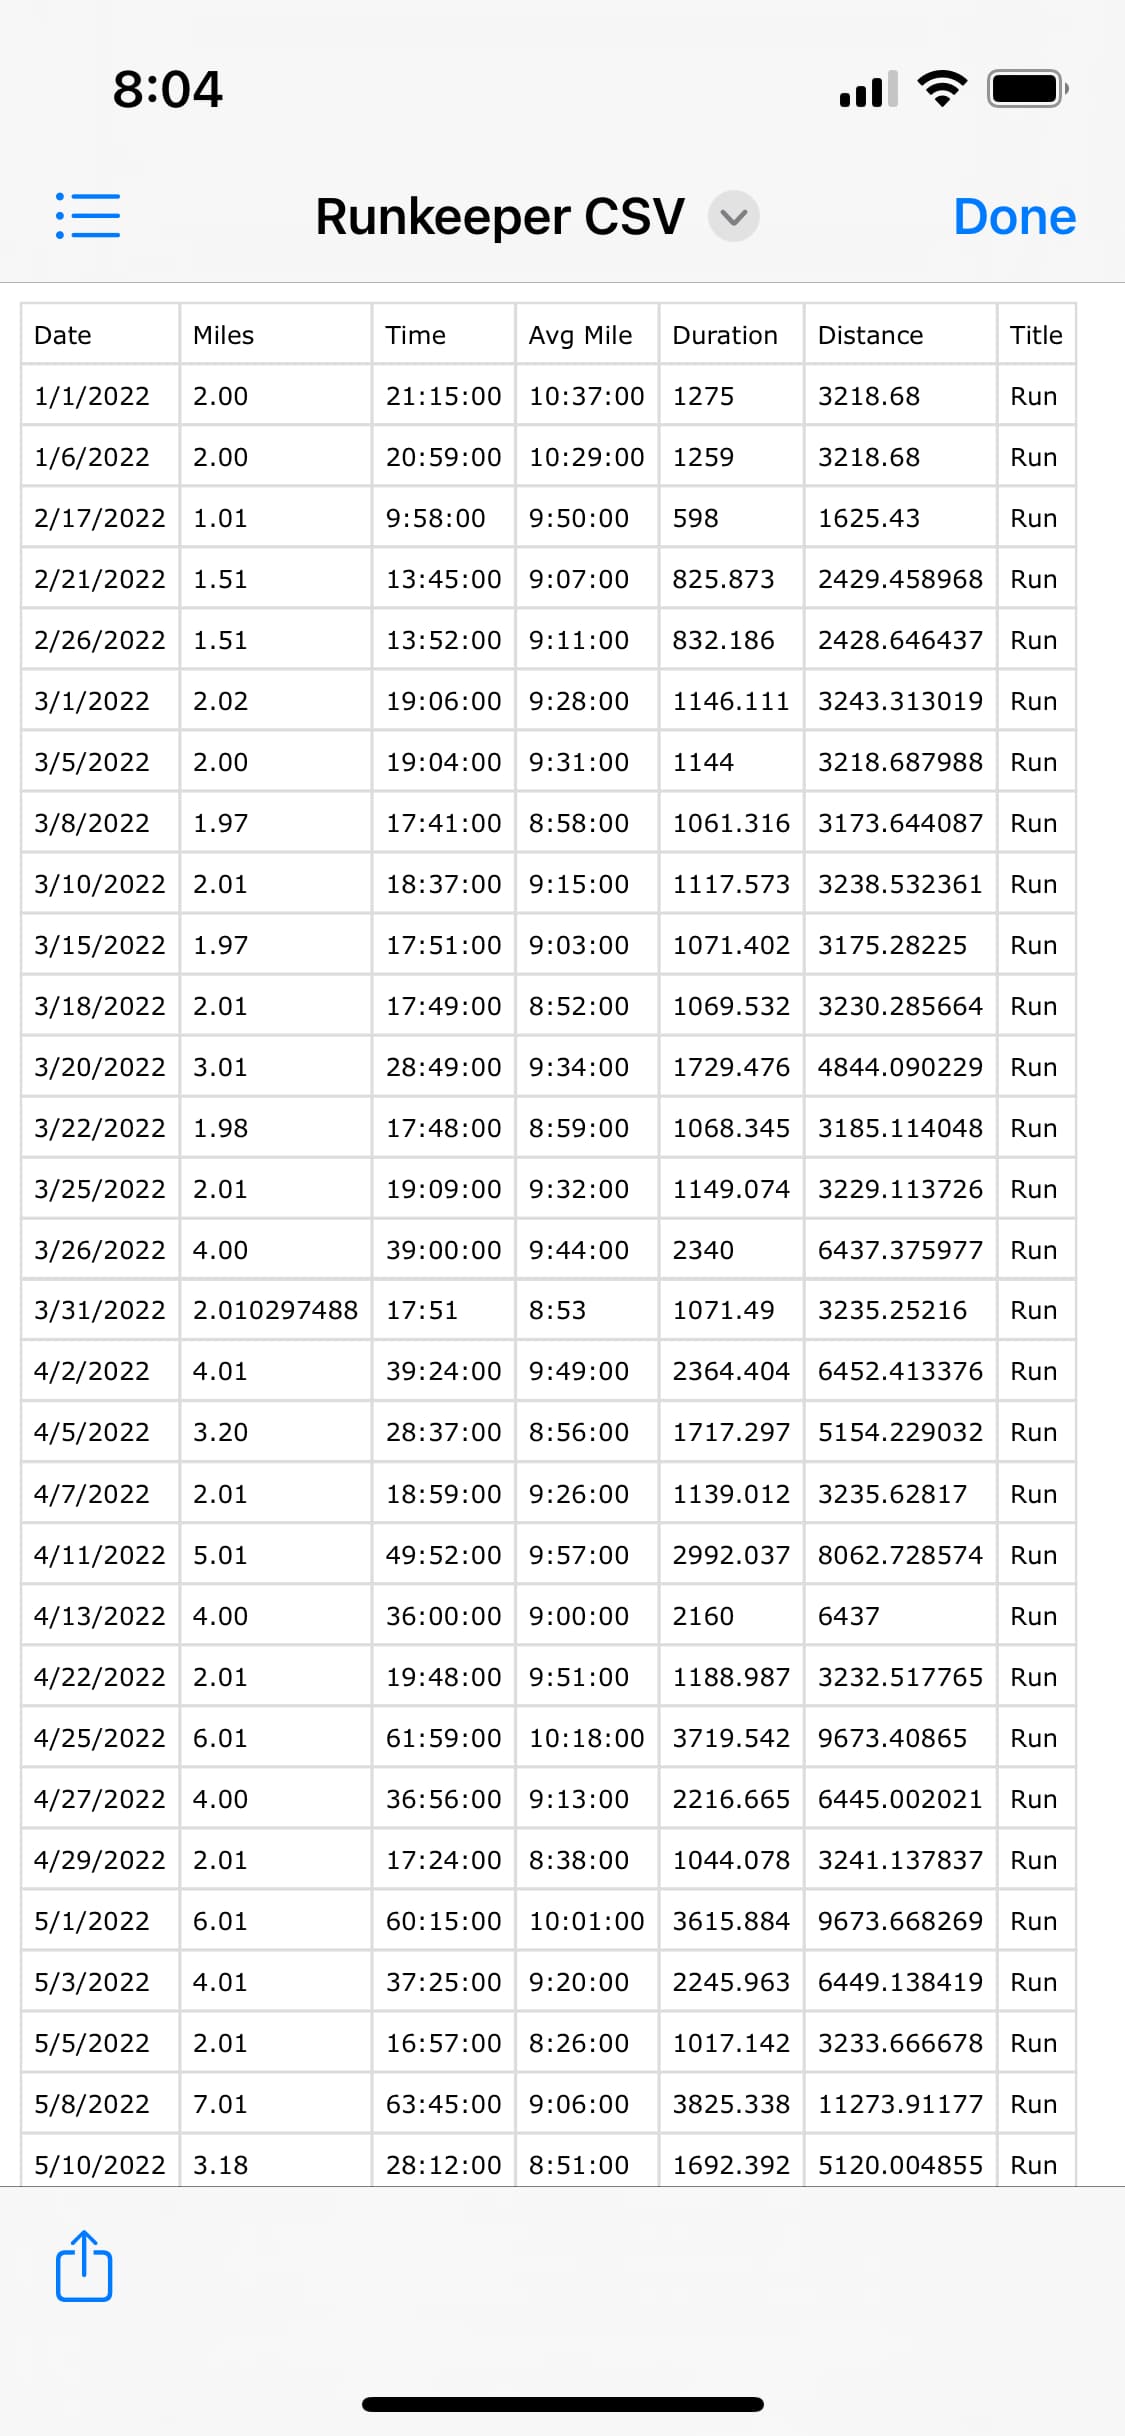
Sorry I haven’t provided enough context. I’m writing a CSV parser and am interested in how people format their spreadsheets (or text files) so that I can cover as many formats as possible.
Have to ask why? There are CSV reader (and writer) packages available for most of the commonly used programming languages. Python, ruby, perl, and others. The open source R stats package, very useful for analysing collected quantified self data, does it out of the box. Plus, of course, every implemented spreadsheet program reads CSV (and TSV) as a native format. The SQLite database system eats CSV files for breakfast even the 8Gb one containing the US Embassey Cables released int the public domain by WikiLeaks.
Depends on what the spreadsheet is intended to track. My exercise one has rows for each excursion — I walk ratehr than visit a gym — with columns for date, route taken, time (started), duration, number of steps taken, and a free text comment about the route
2022-09-28,Local woods clockwise,16:45:30,1:01:20,6500,GPS Track incomplete 2022-09-29,Local woods counter-clockwide,13:00:00,1:00:00,6000,Timer stopped for a chat with neighbour out walking their dog
All those dates/times/durations are calculated with Numbers functions. And as the second comment suggests the duration is not contiguous. I will stop the timer for various events.
I have a separate spreadsheet for blood pressure monitoring with date, dow, diatolic, systolic pressure. But I may extend the dia/sys to more cells if my general practioner has requested a three-reading average.
The two sheets are not linked.
I have third for tracking when I need to descale my coffee machine and using an average function predict when the next descale is likely to be needed. For a while I was tracking my use of the coffee machine because it was not producing crema on my espressos. (That problem was solved thanks to a press report on how commerical coffee shop could save money by not packing the grounds into the filter.
The coffee filter prediction is really interesting. I do something similar where I track when I change my water filter. I am supposed to change it every 2 months so I was thinking to add a reminder to the app that I can set - “remind me 2 months from last update”. Having the app predict and be proactive about reminders could be really useful.
A quick look in the Xcode documentation reveals there is a CSV type declaration. And for Swift code a whole bunch of functions to read/wrtie it. Have a gander at the Tabular Data section of Swift documentation in Xcode and specifically the section CSVReadingOptions.
How are you going to map an arbitrary “spreadsheet” to the database within your app? Are you relying of being able to infer a mapping from the column names contained in the first line of a CSV file? The number of cases is as large as the number of people collating QS data because as I said at the begining we set up spreadsheets to do what works for us.
It is doubtful that much thought goes into the “design” of personal spreadsheet. Even though I have experience of database design with 1NF through 5NF analysis I throw my own spreadsheets together. Also encountered the problem in a non-QS situation with recommendations from a national society on how to organise spreadsheets for local groups survey results where the “design” was not first normal form. It was horrible to work with (I took over maintenance of our local chapters spreadsheet).
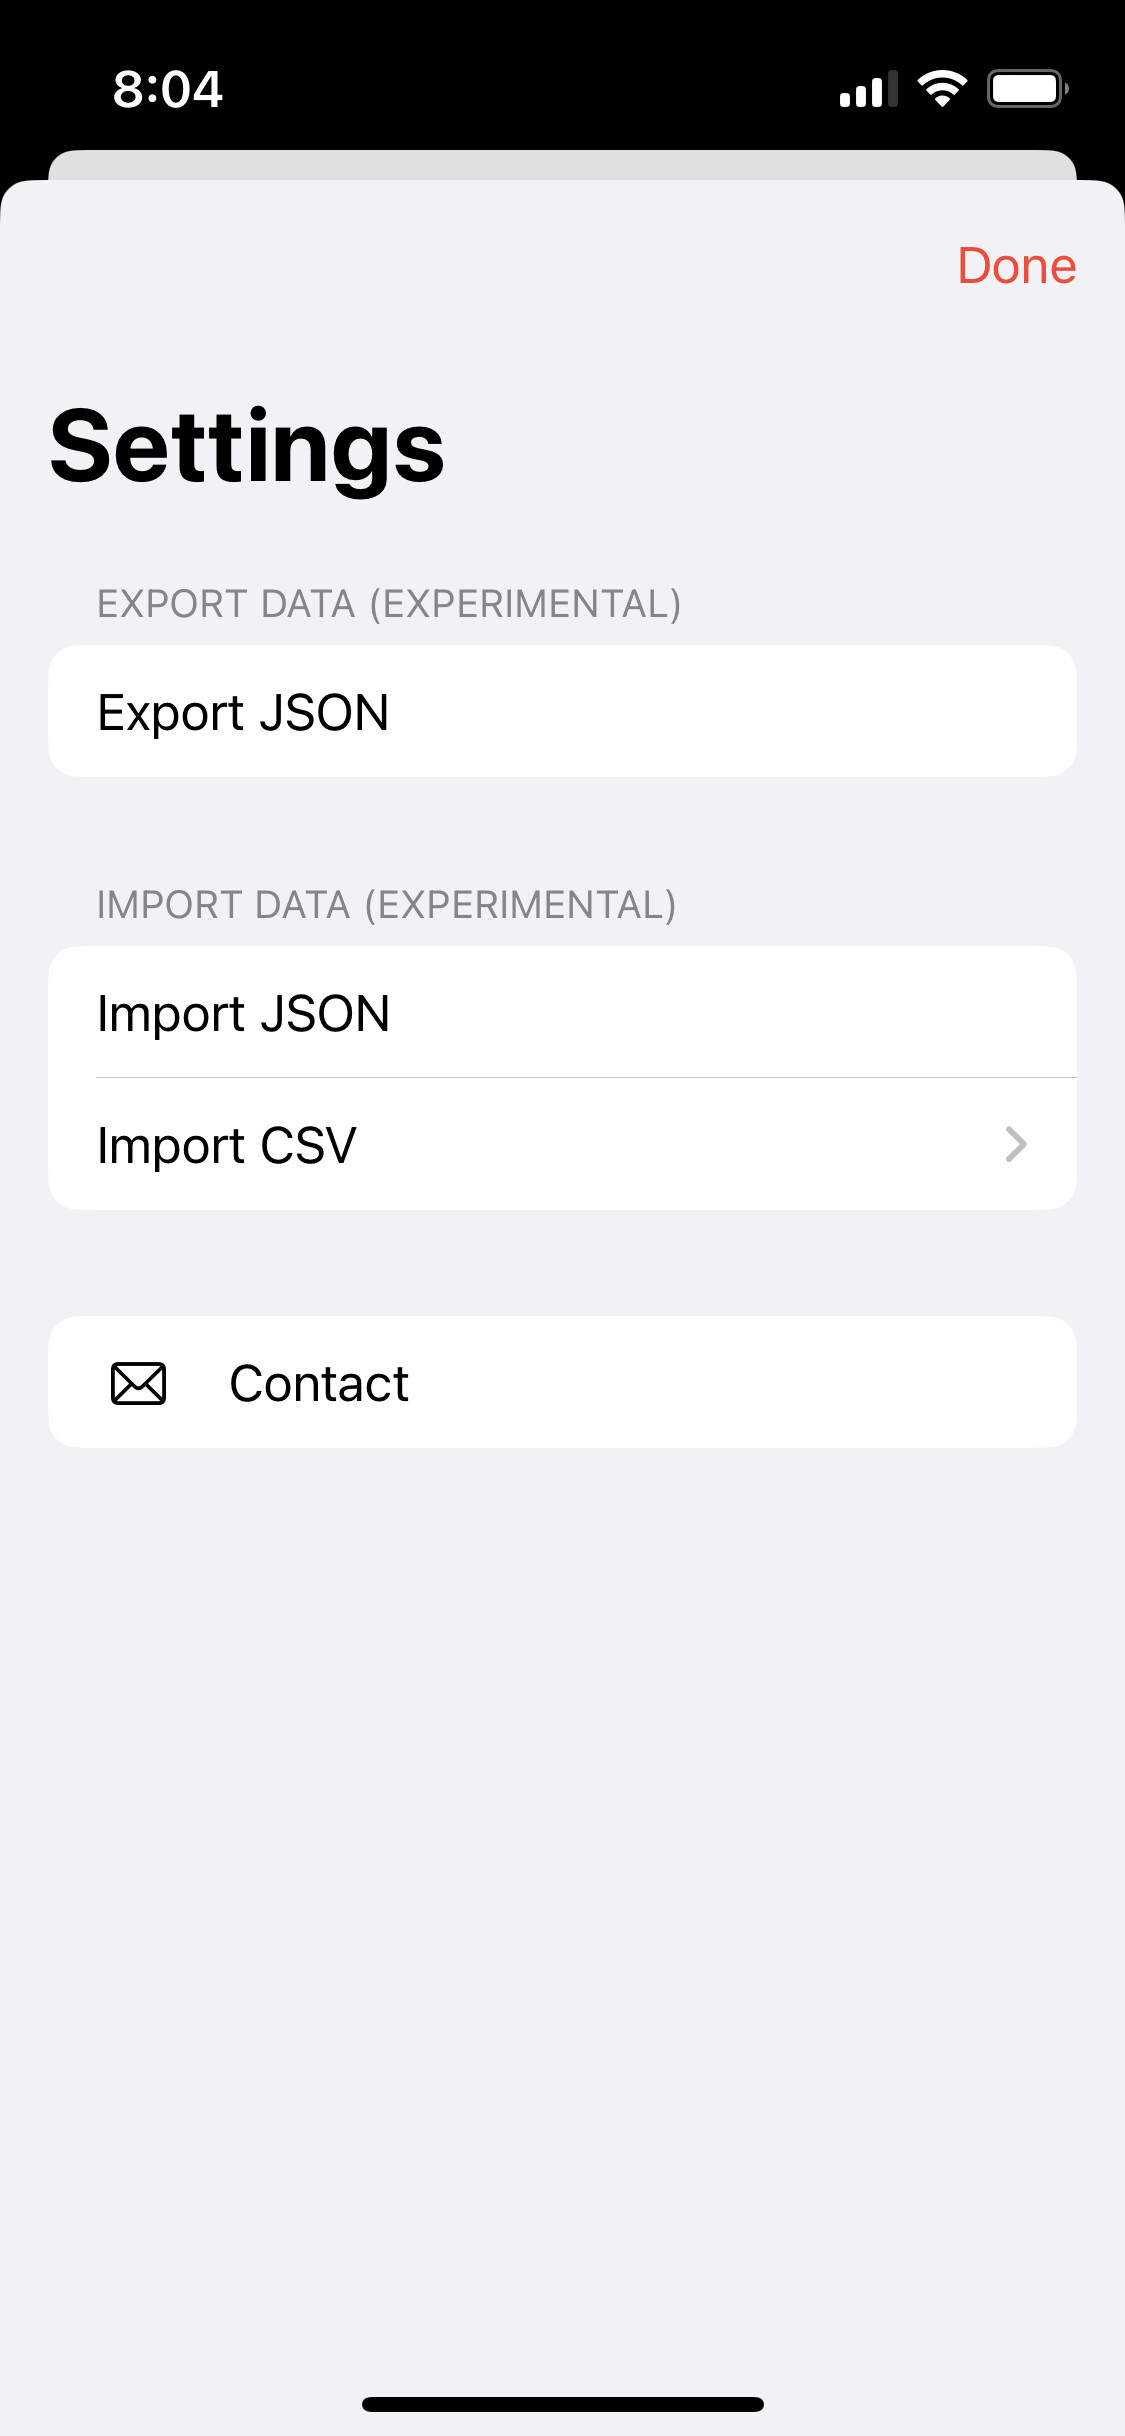
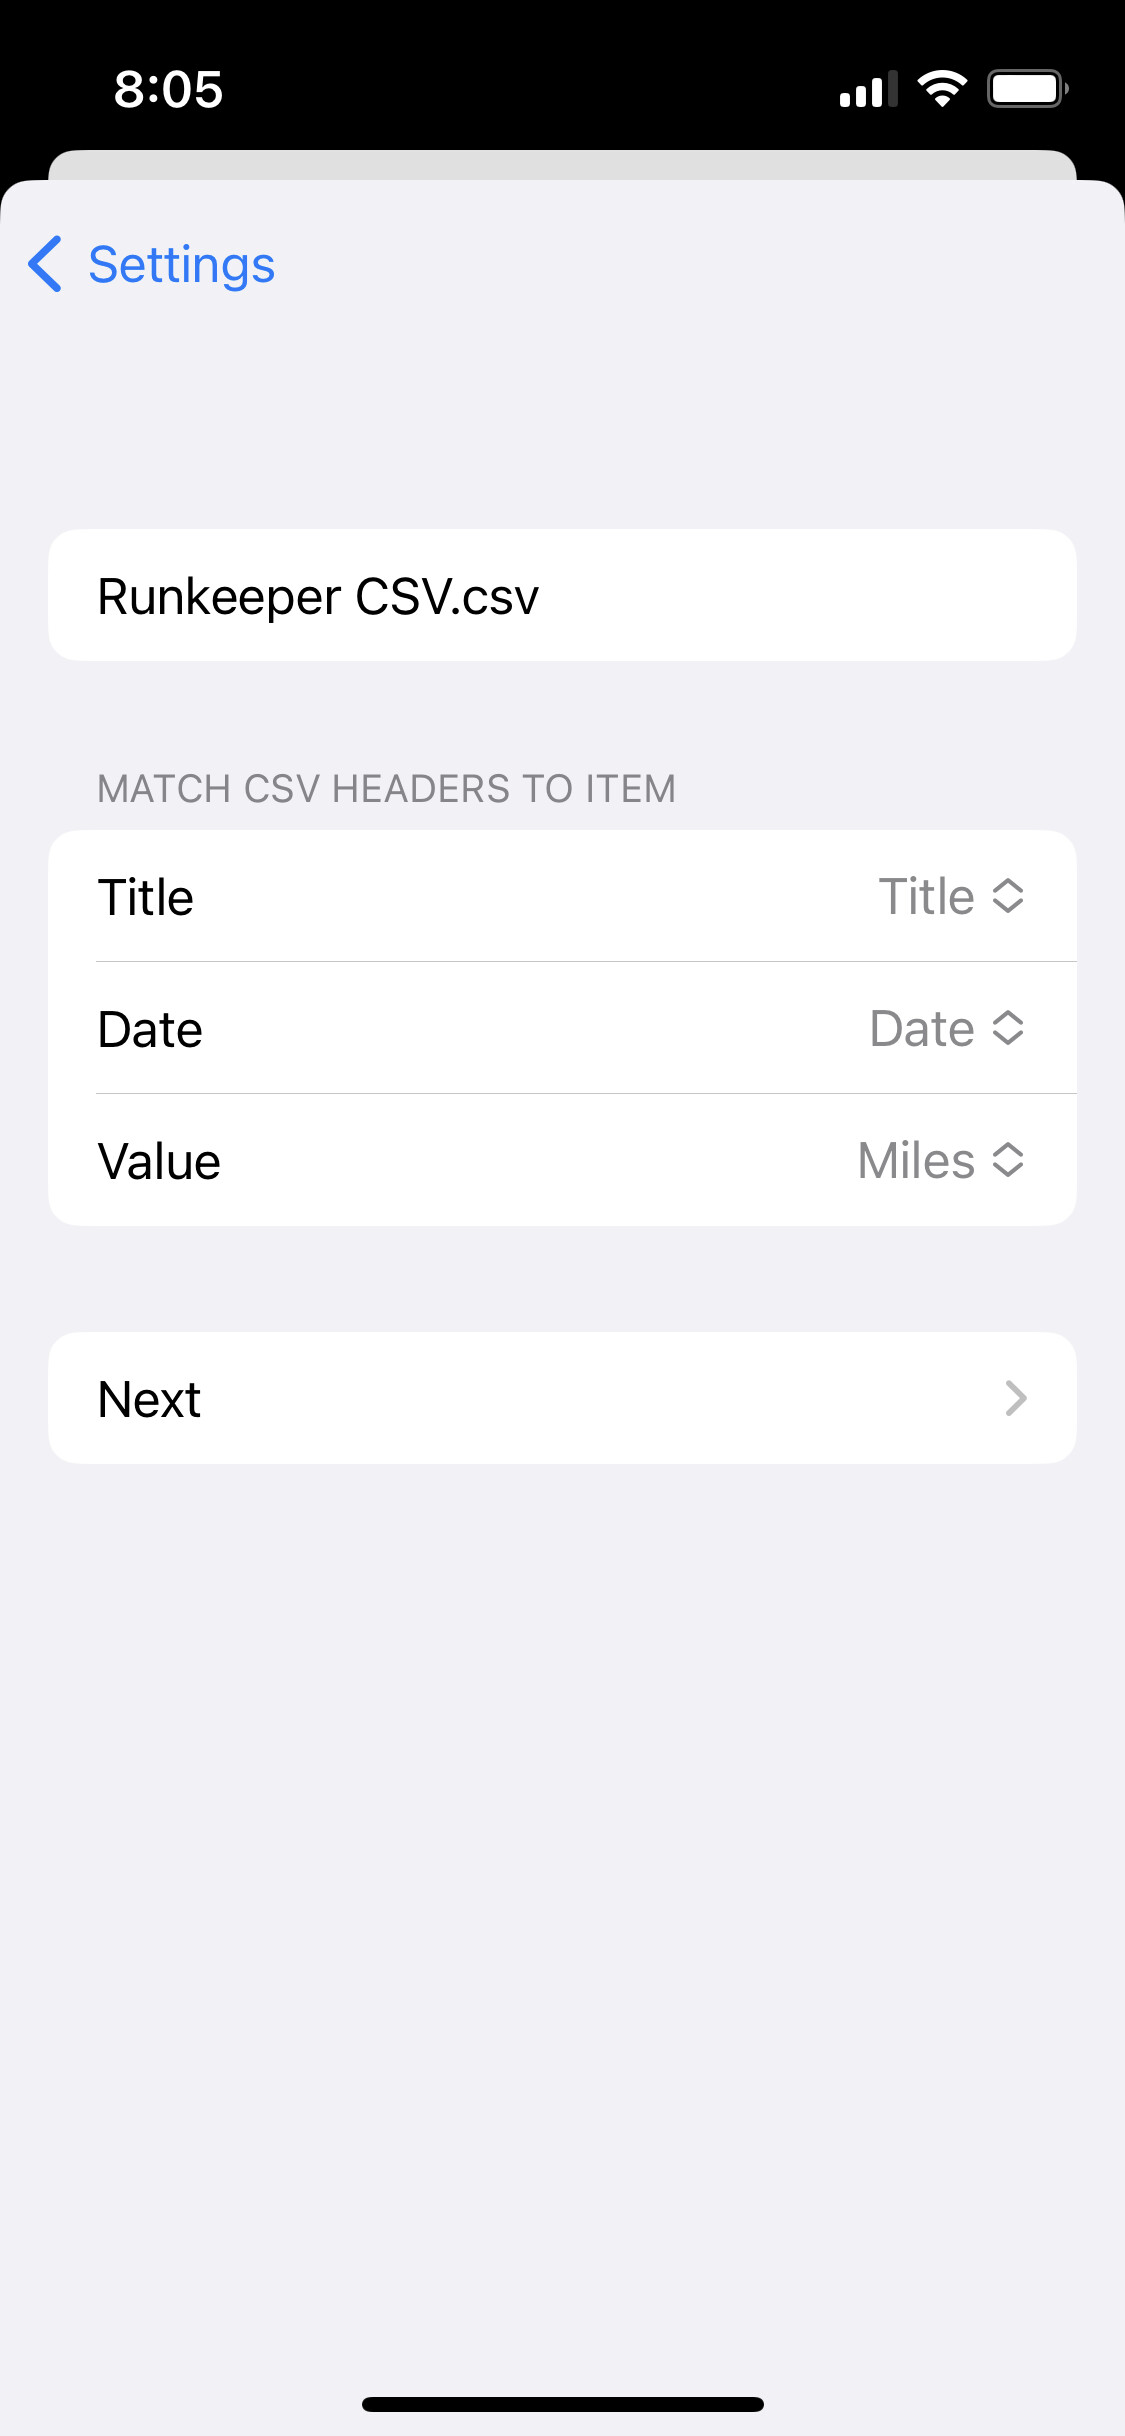
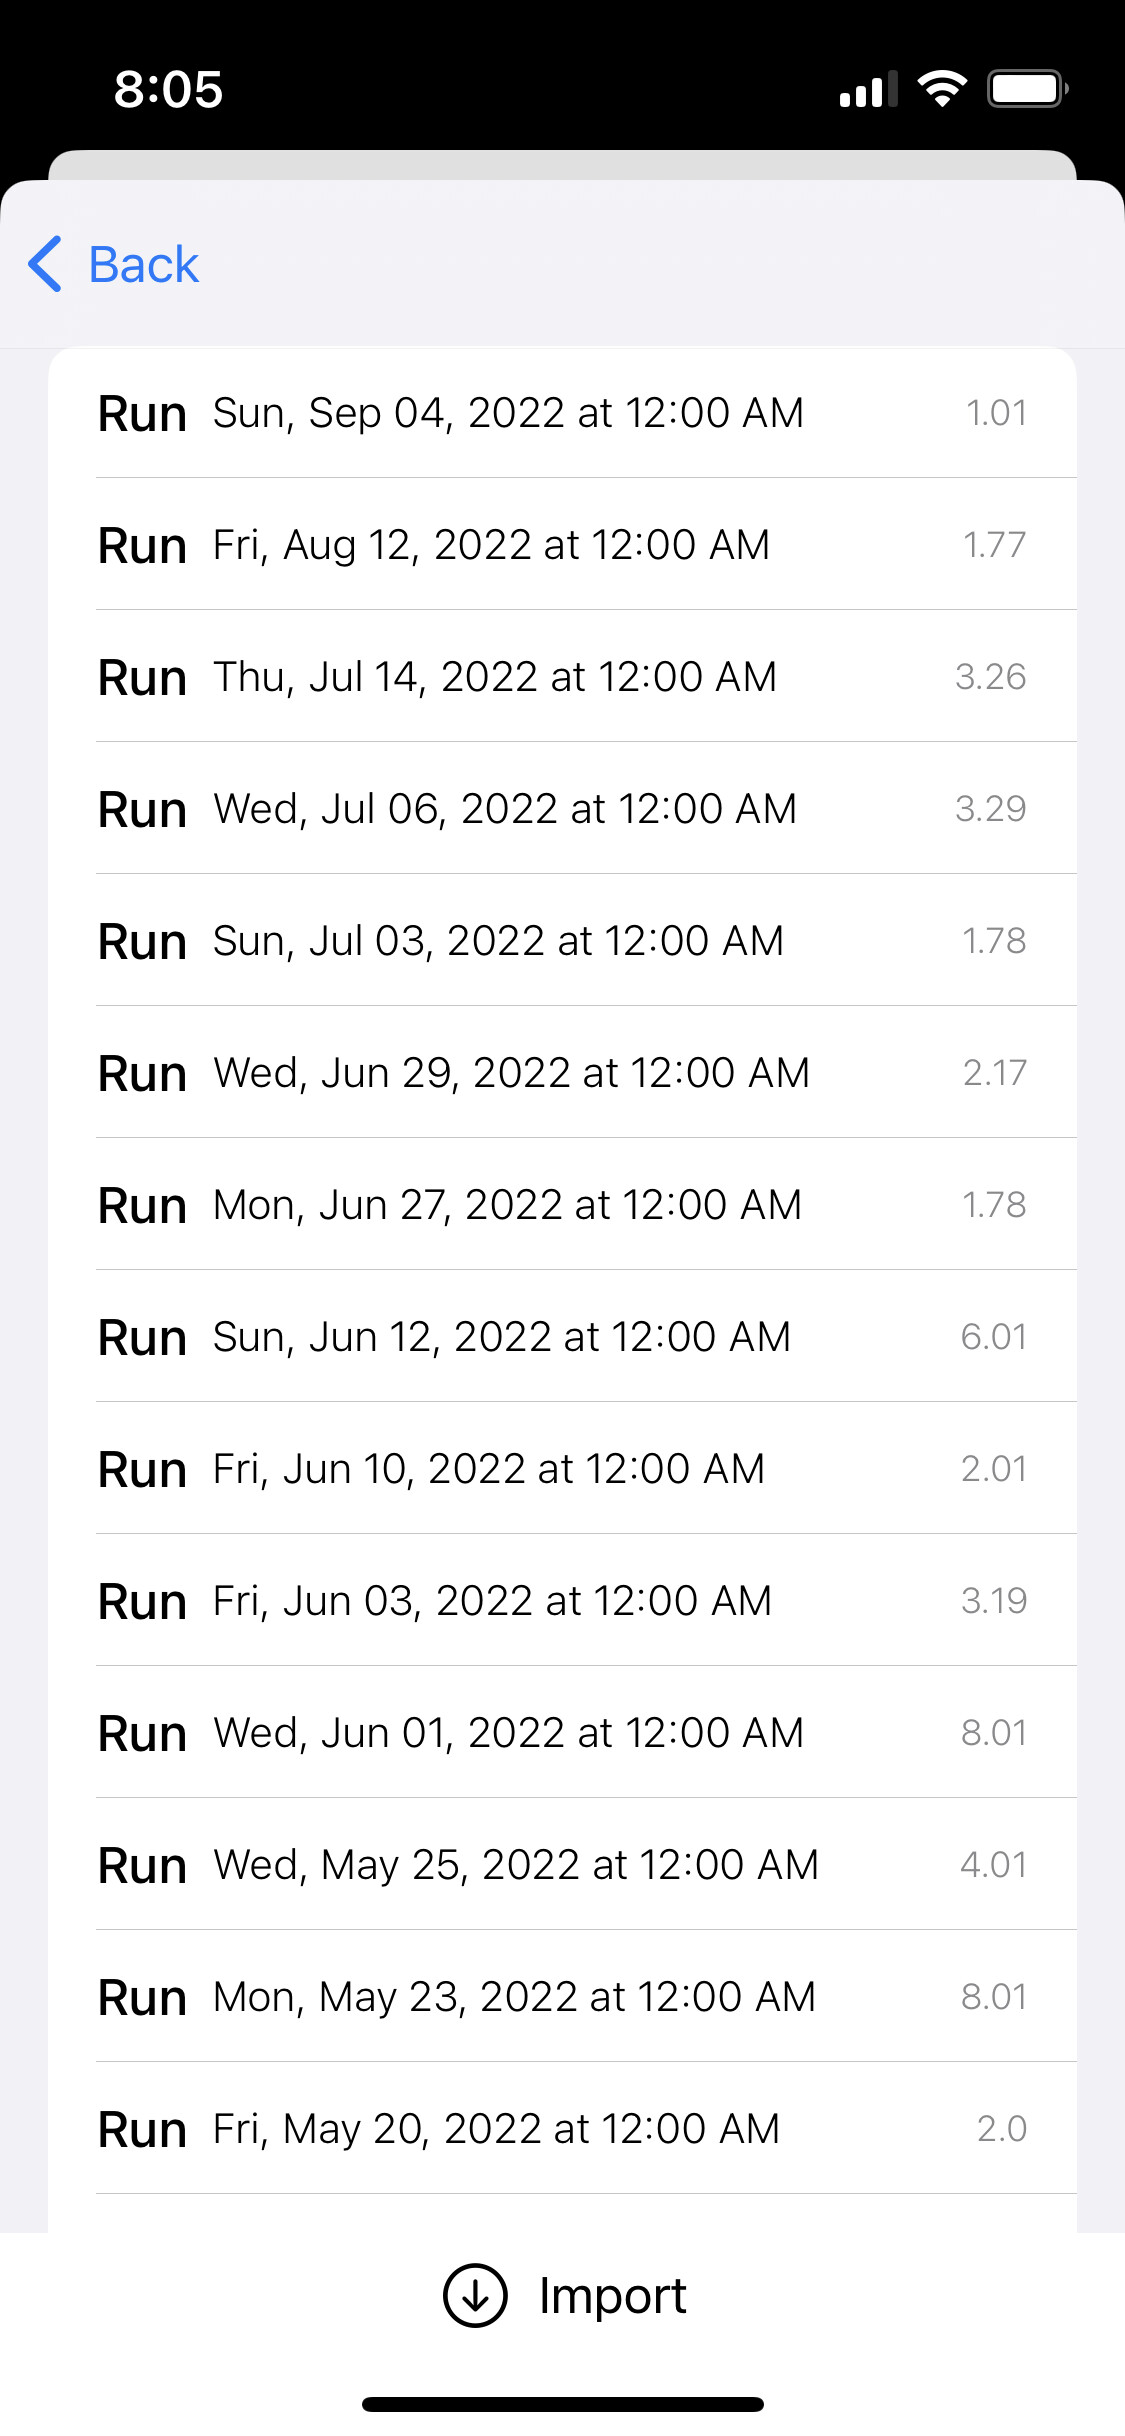
For now, I expect a header row and then allow the user to map it to DB properties. There are only 3 at the moment - title (of item you are tracking), date and value.
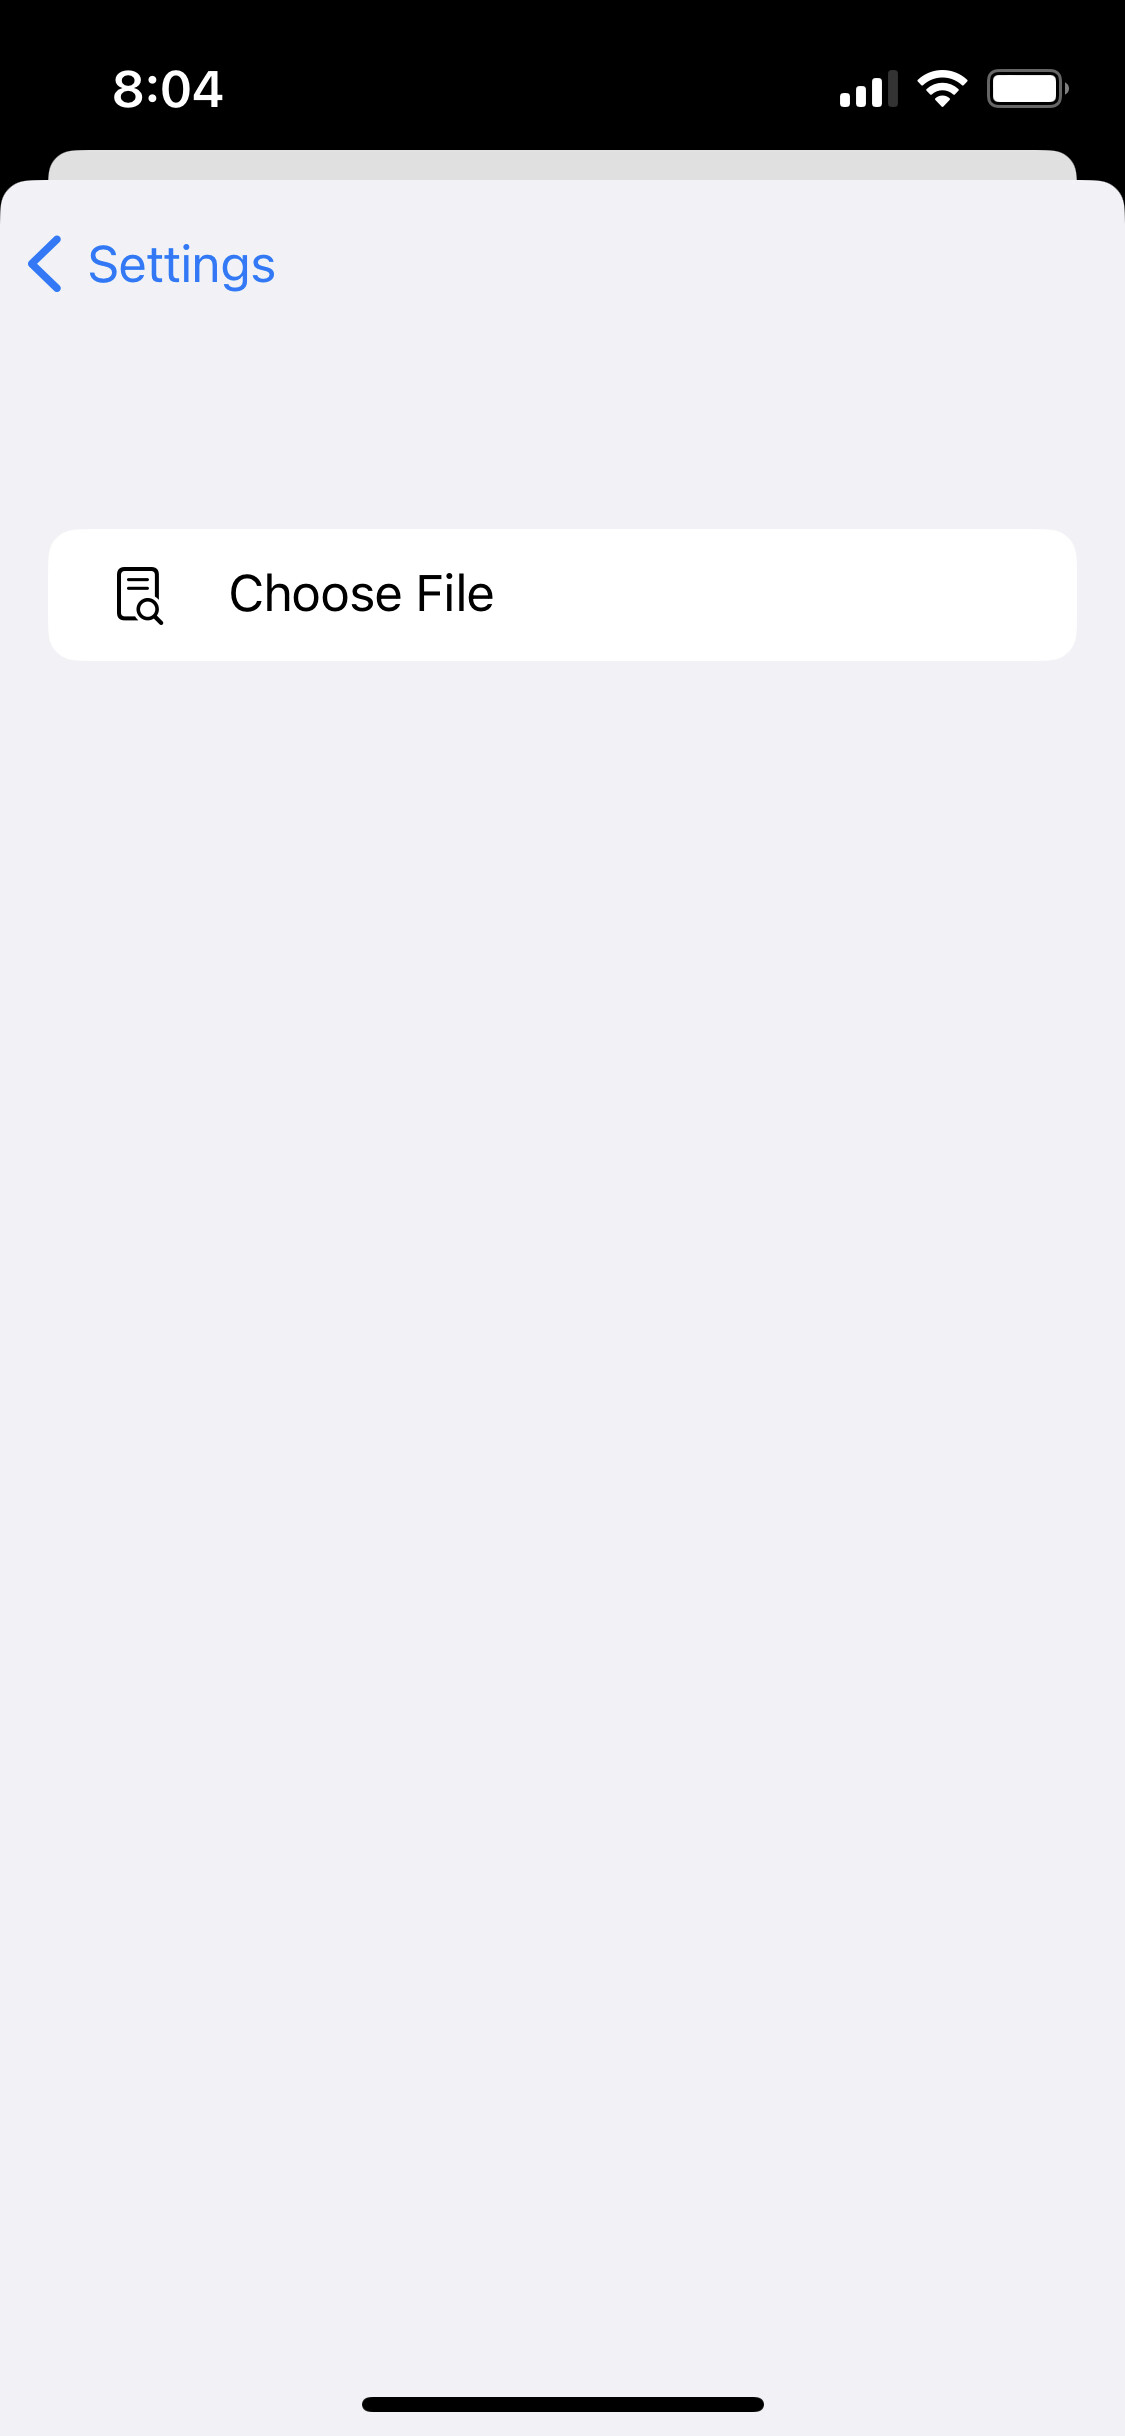
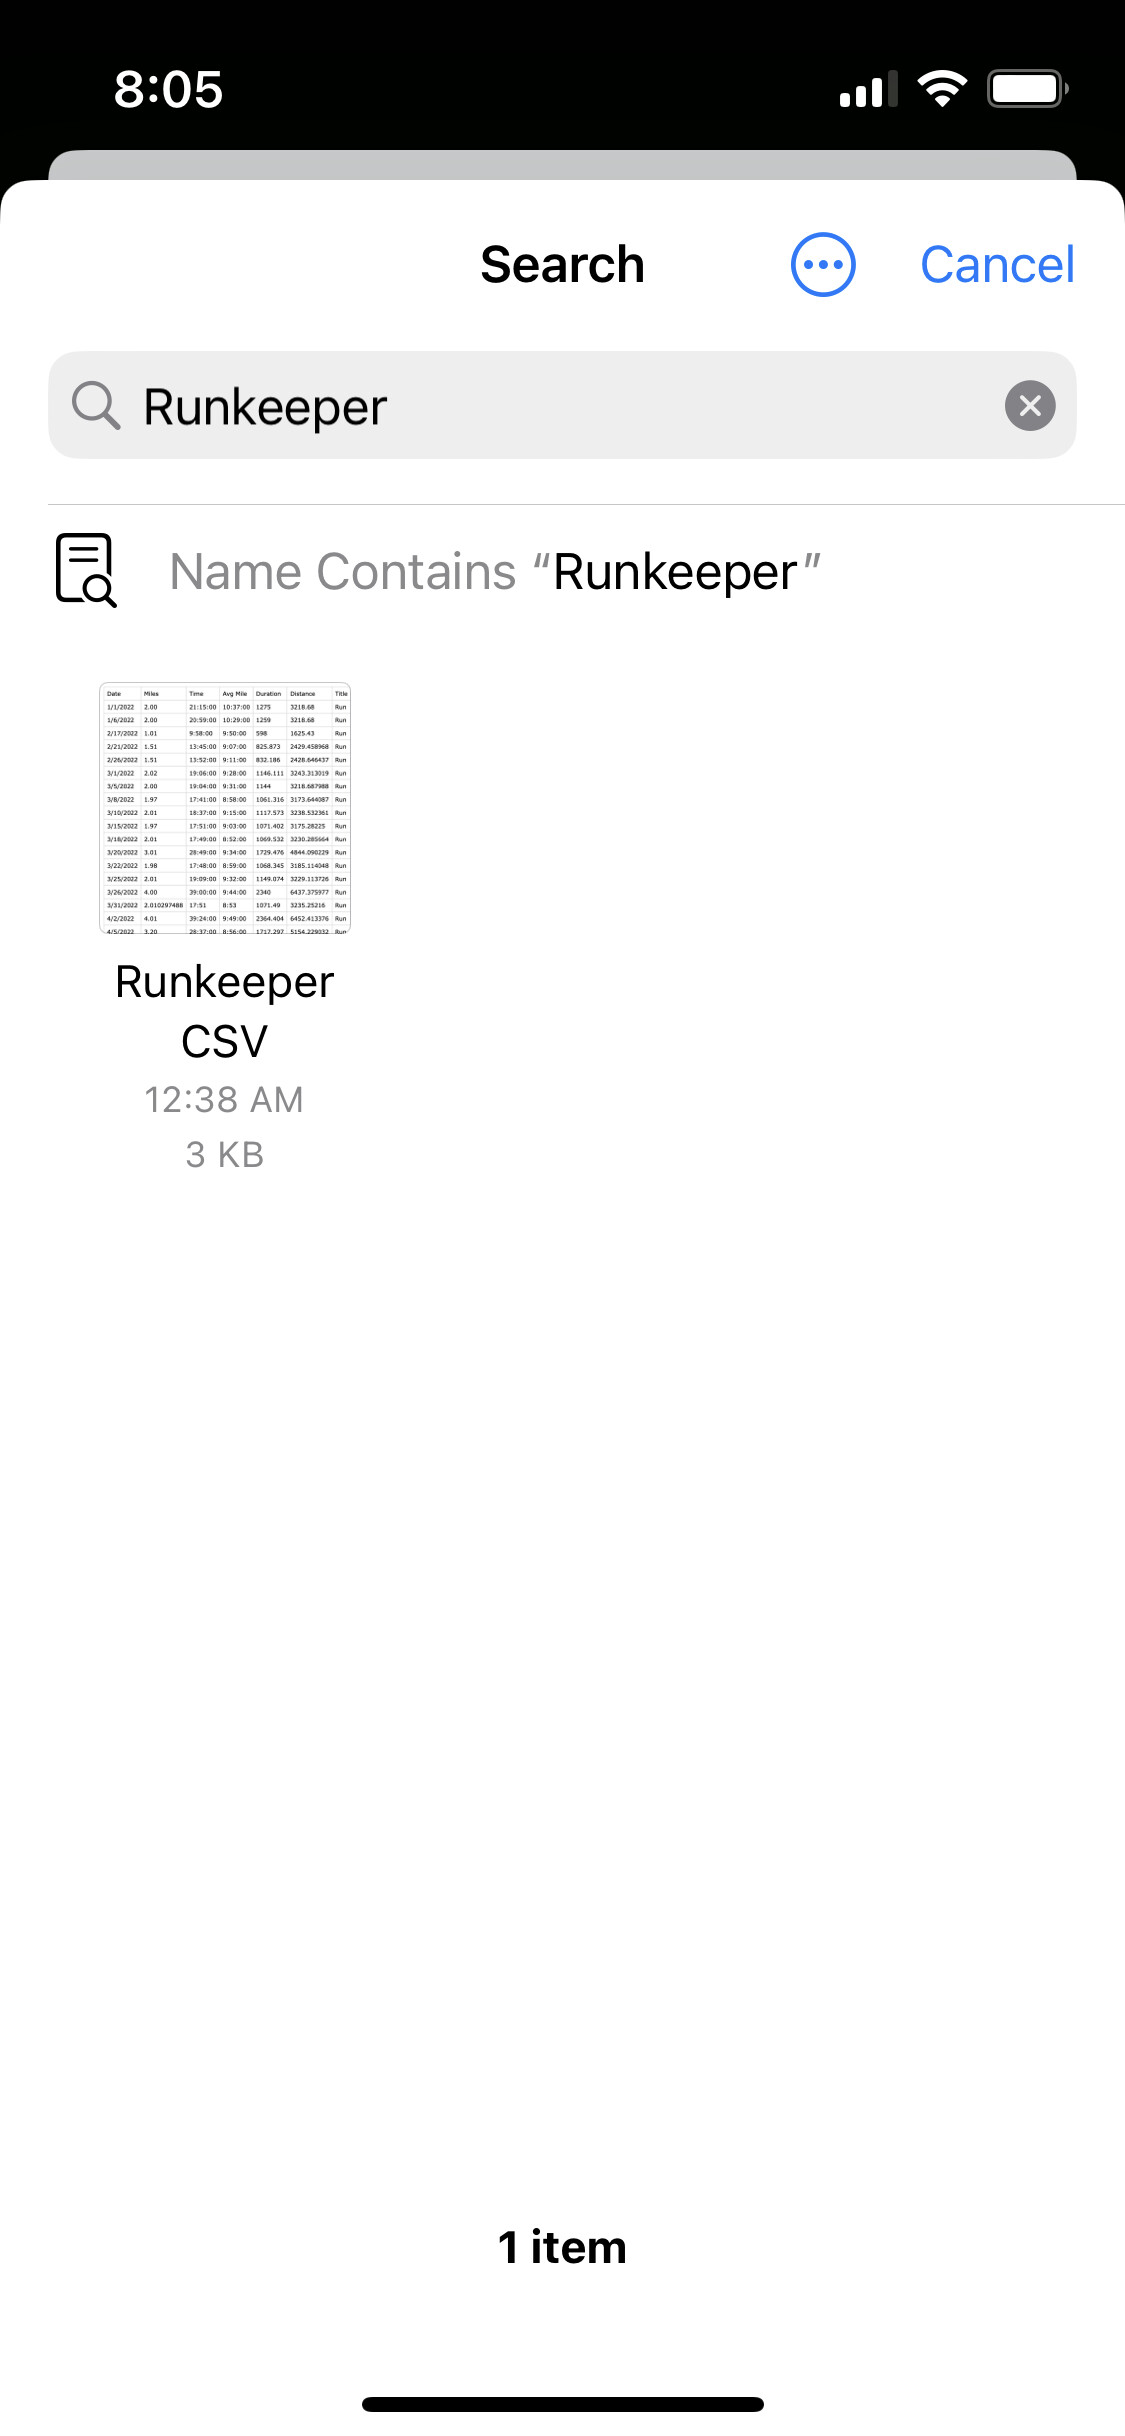
Here are some screenshots showing the process. It’s early days, so this is all in flux. I’m looking for early testers!