I’m starting to go through the studies that identified the clinically relevant taxa. From am initial look some of the studies are a bit s mall (n=30). Too early to say much until i complete the meta analysis. Either way, this is a good first start in understanding how (if) the mircrobiome can be leveraged to help these conditions which a lot of folks really struggle with.
Also, i believe genova dx has done a similar study but not sure if its published.
To put this into perspective, I tested the same stool in 2 different places and got greatly varying results of Faecalibacterium, one of the taxa mentioned in this study, differed by quite a bit.
Gut (3/10/2017) - 0.49%
Gut (3/10/2017) - 15.85%
Looking at all my tests, it seems that abundance is quite modulated on high I sample (toilet paper vs sampling from a hat – usually from the hat I mix it a bit more).
Gut (3/10/2017) - 0.49%
Gut (3/10/2017) - 15.85%
Gut (3/02/2017) - 9.61%
Gut (1/28/2017) - 1.27%
Gut (11/12/2016) - 0.28%
Gut (7/28/2016) - 10.54%
Gut (7/20/2016) - 11.14%
Gut (7/17/2016) - 4.32%
Gut (7/13/2016) - 13.73%
Gut (5/27/2016) - 0.26%
Gut (3/24/2016) - < 0.01%
Gut (3/02/2016) - 7.59%
Gut (2/17/2016) - 7.52%
Gut (1/11/2016) - 11.77%
Gut (11/29/2015) - 0.20%
Gut (9/10/2015) - 0.15%
Anything (9/10/2015) - 0.02%
Gut (6/23/2015) - 9.30%
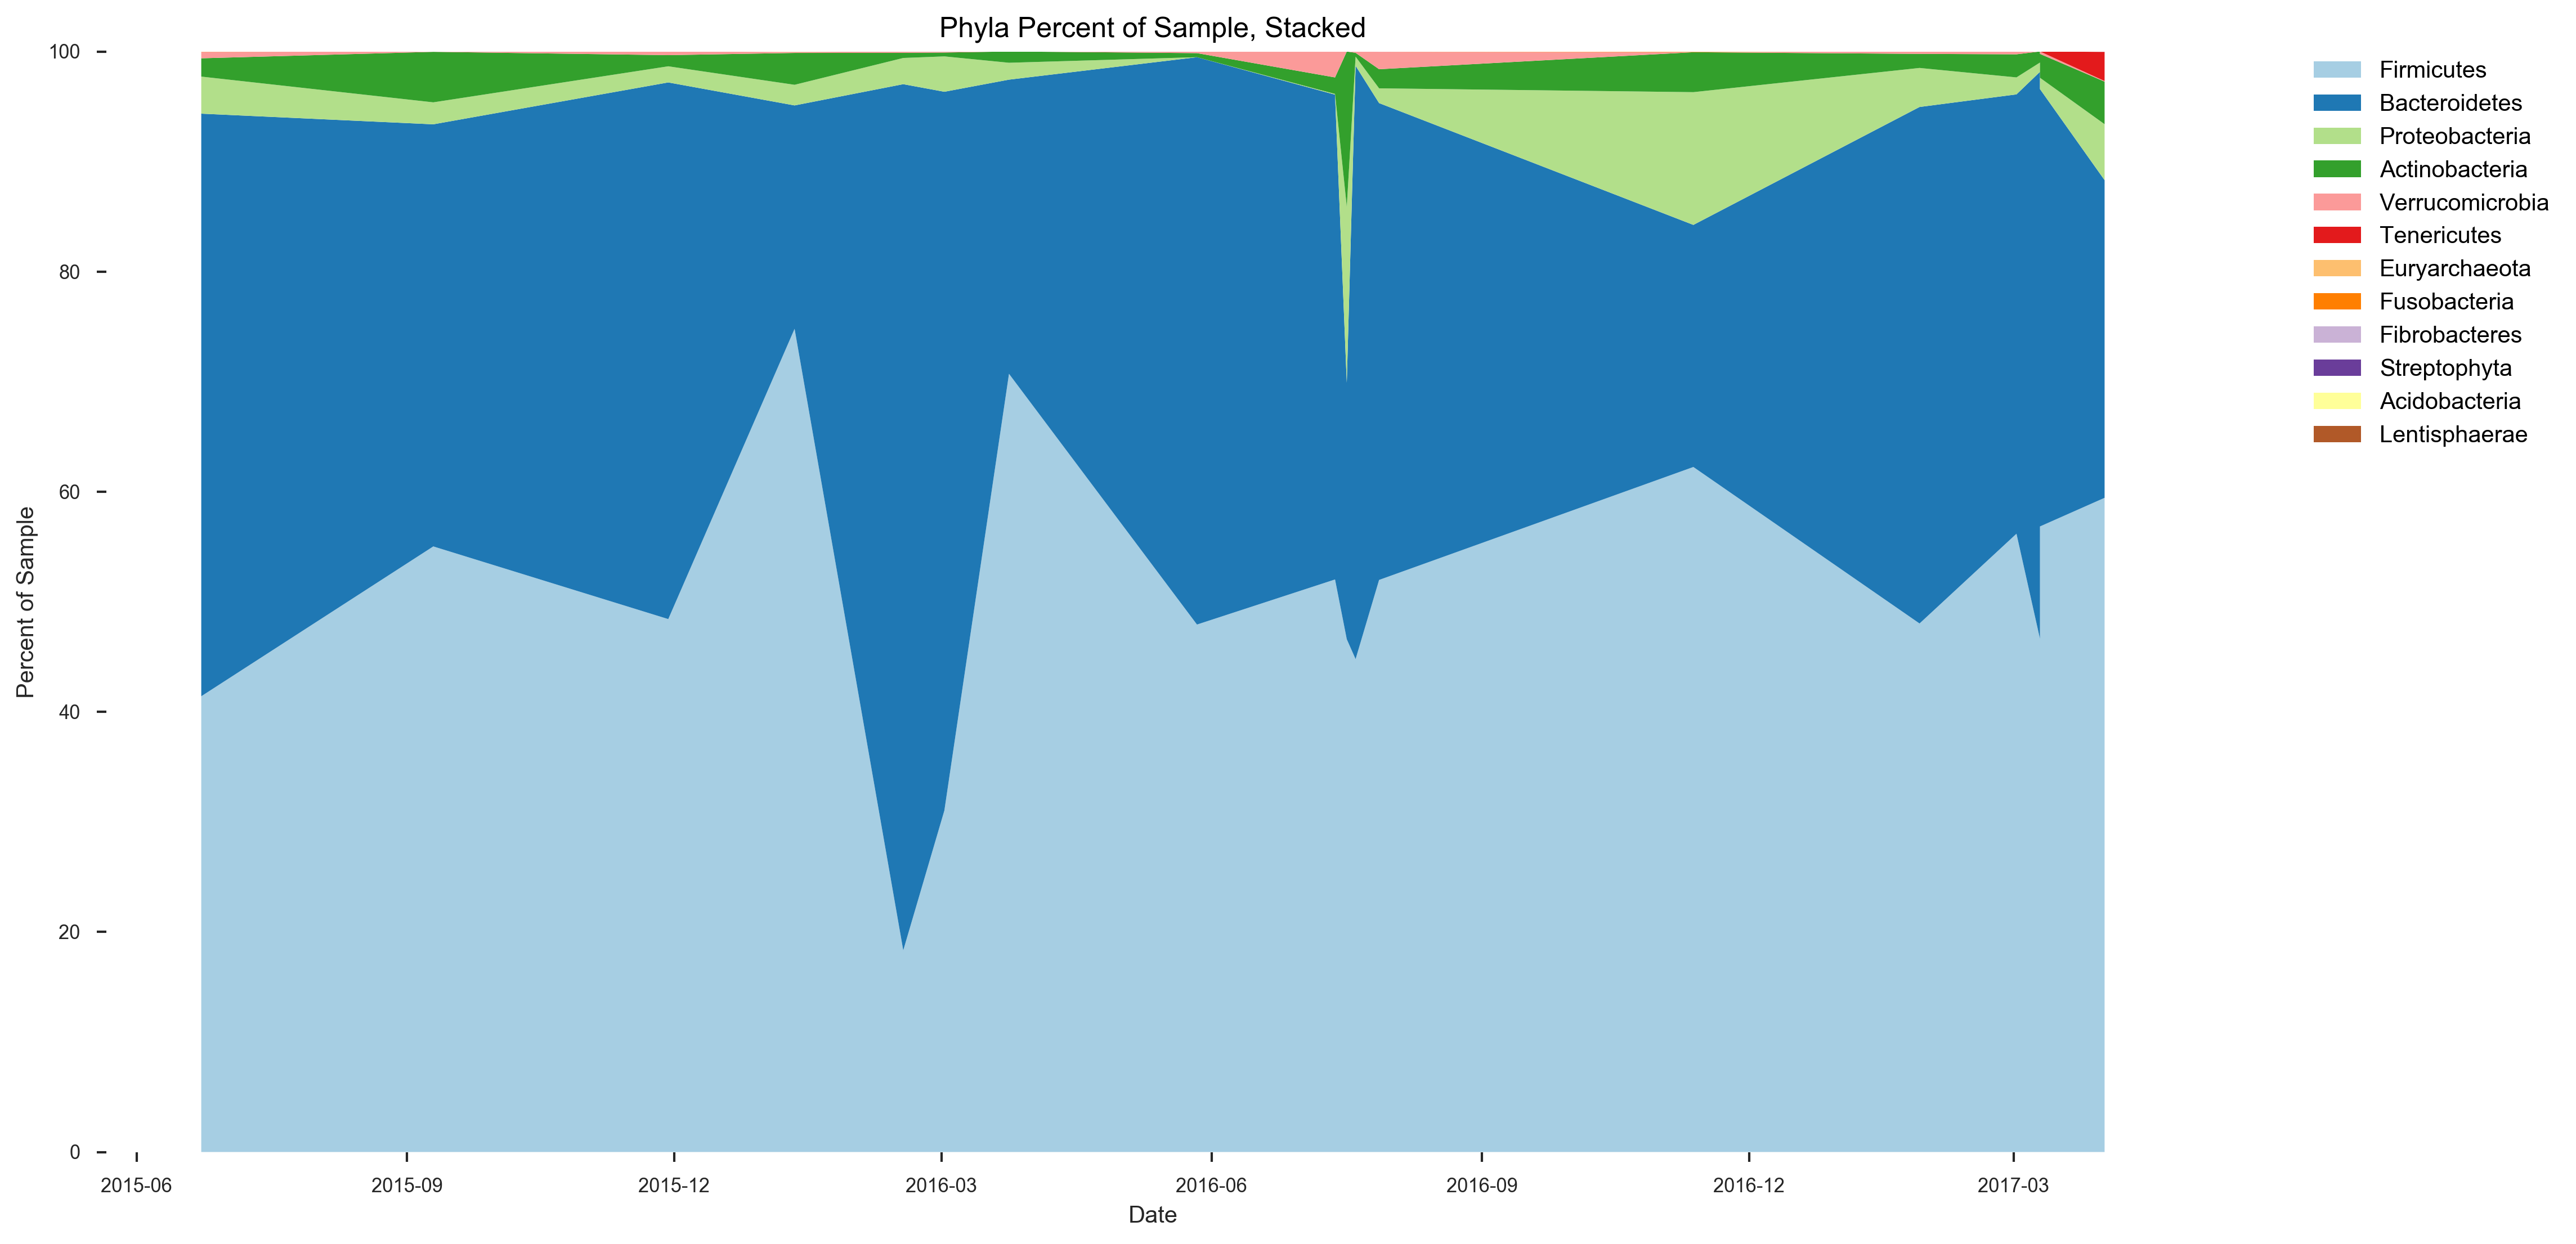
I’ve done two round with ubiome. The first round had some complications, but I did get data from the second. I’ve also submitted a sample to Thryve and am looking forward to their results. See below for my last ubiome summary in relation to the reference ranges: https://blog.adafruit.com/2017/05/04/healthy-gut-reference-ranges/
what do things look like at the family level? Are you willing to post your raw data (json file)? I’d be happy to take a look at it and show you how you compare to me.
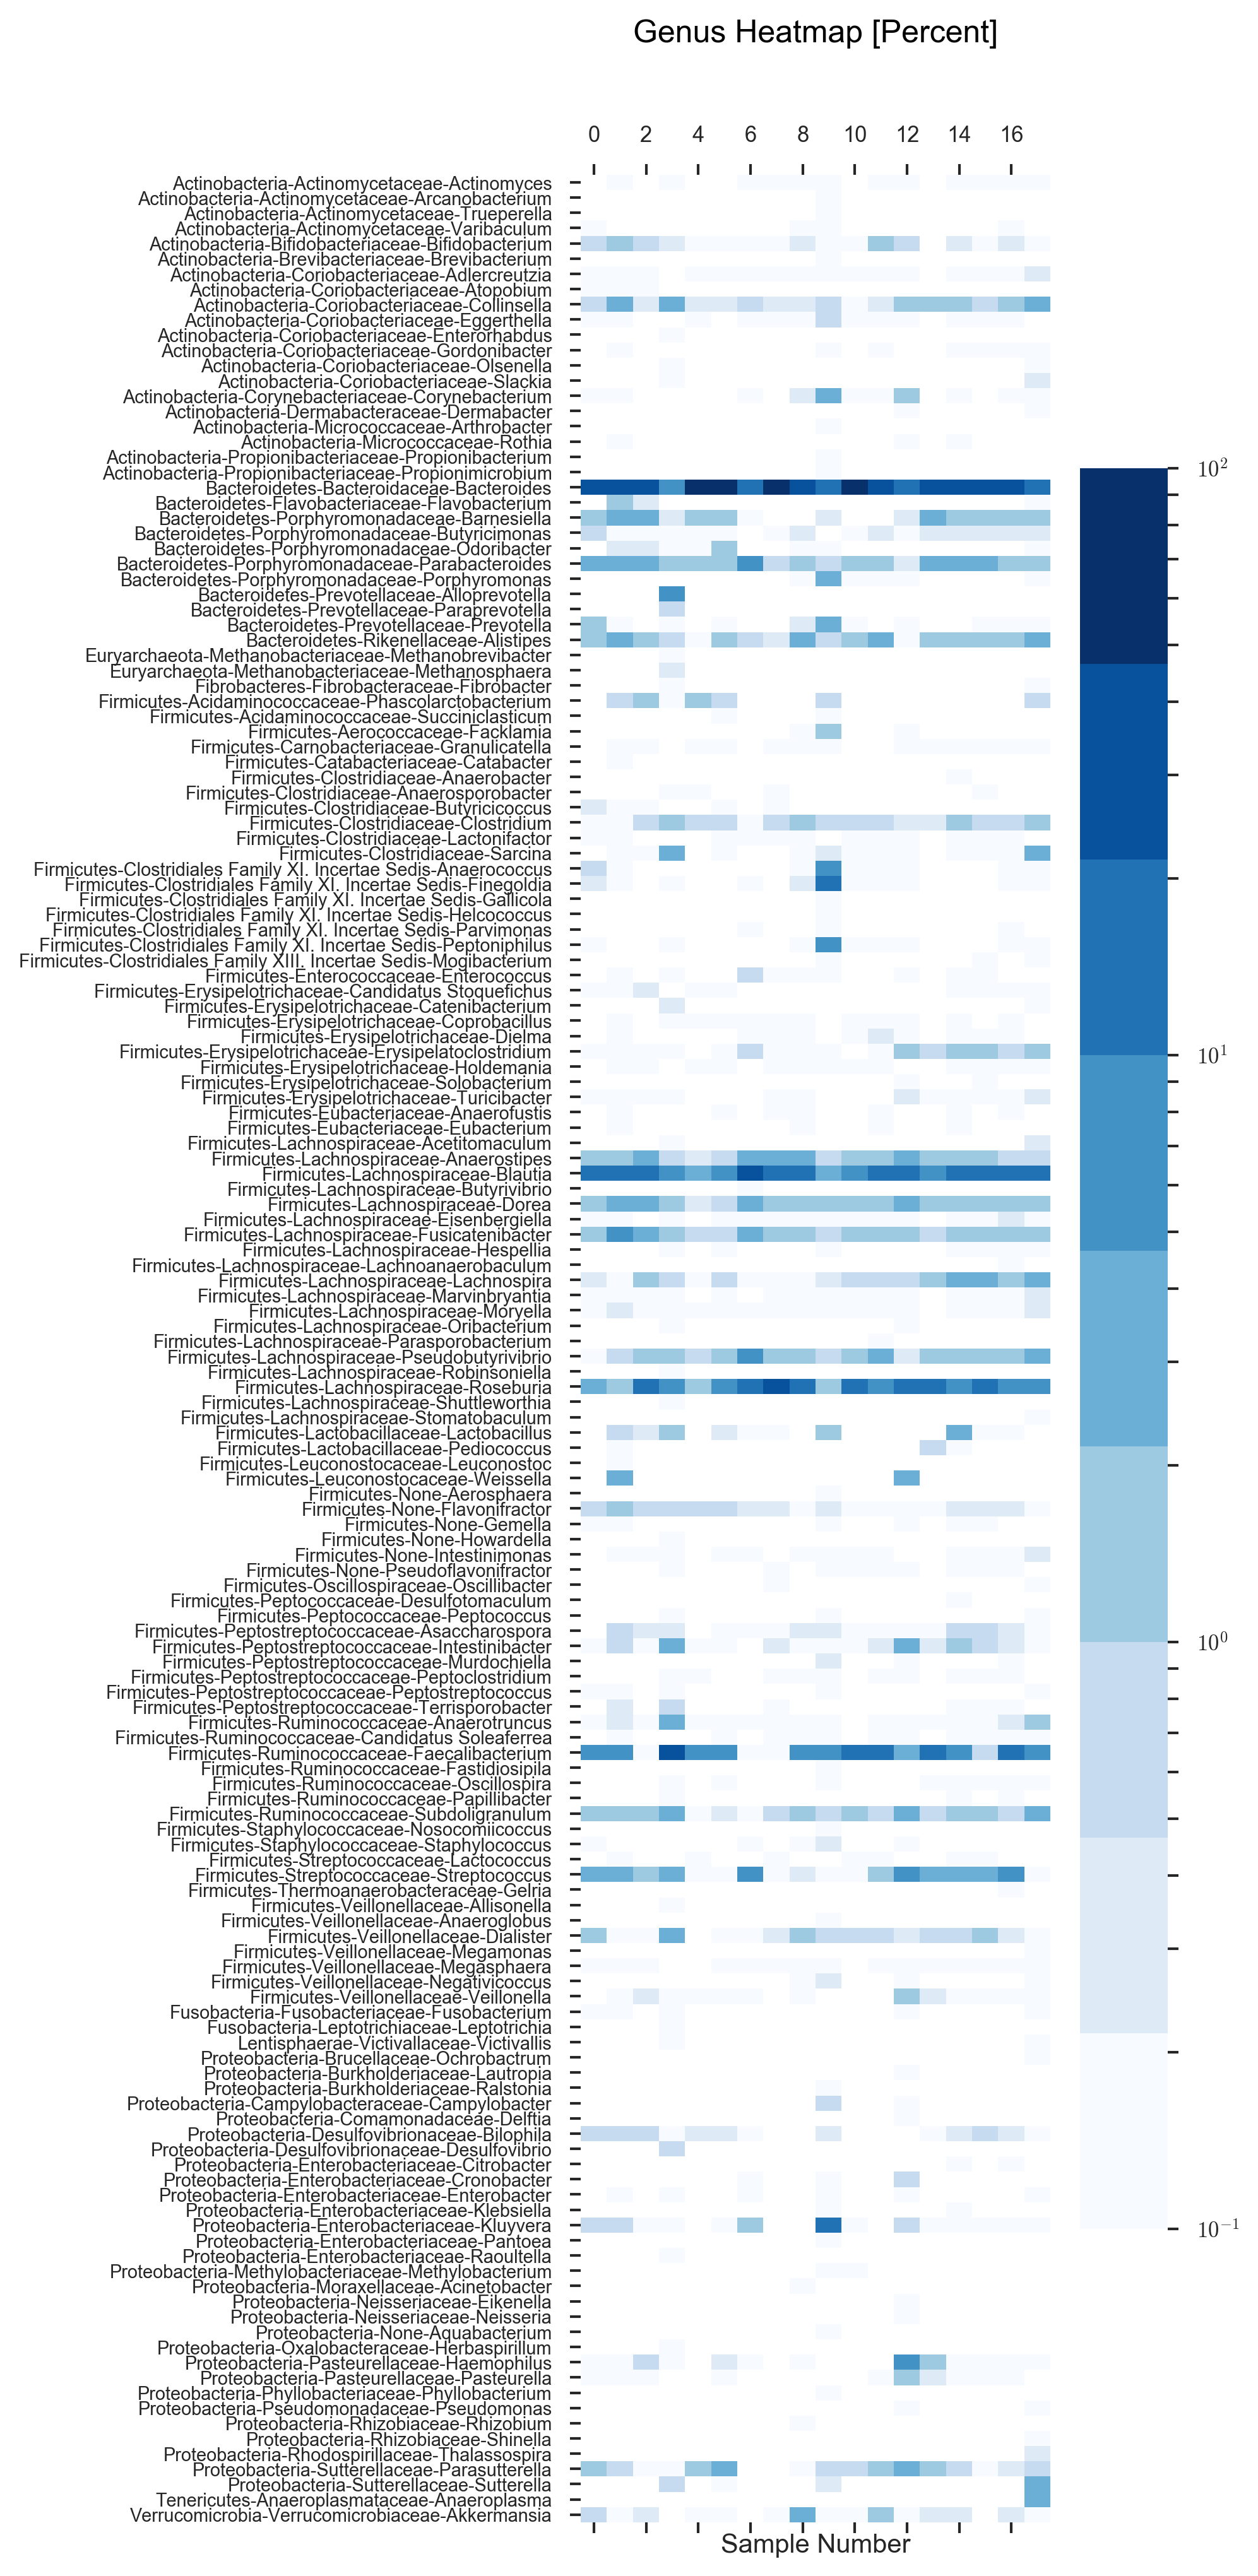
Here are the results from a genus and phyla perspective. The sample you gave me was taken April 2017 so you are the last sample in this bunch and I am the 17 samples before it.
Have you thought about submitting this sample for the ubiome smartgut program? Its currently in pilot stage and I believe free.
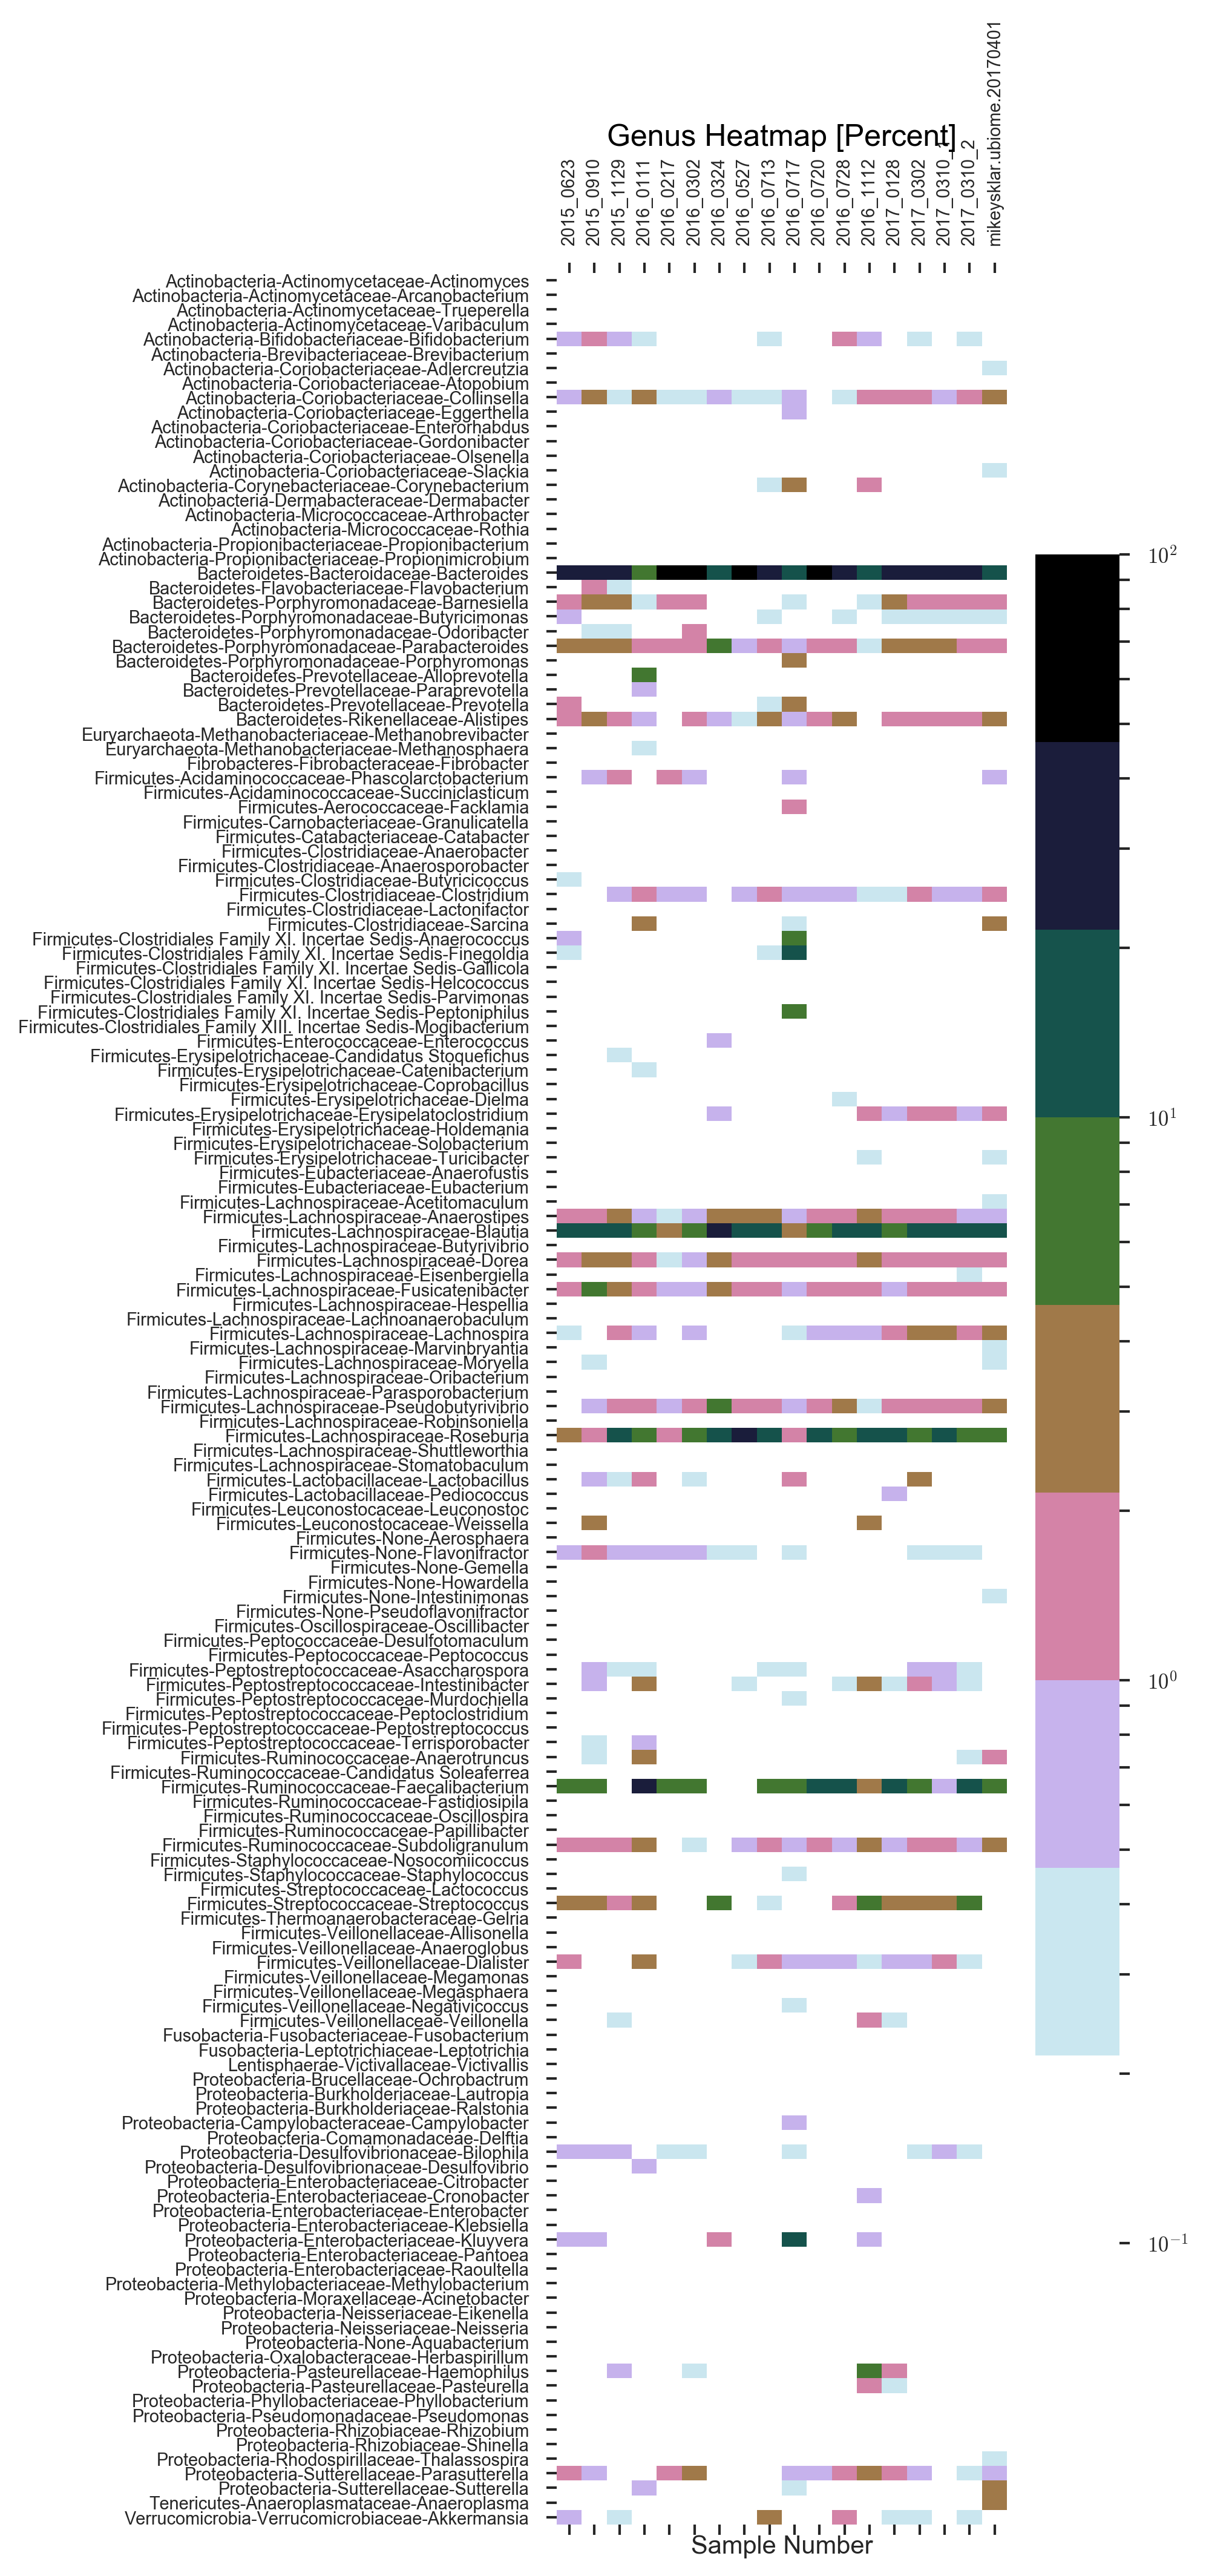
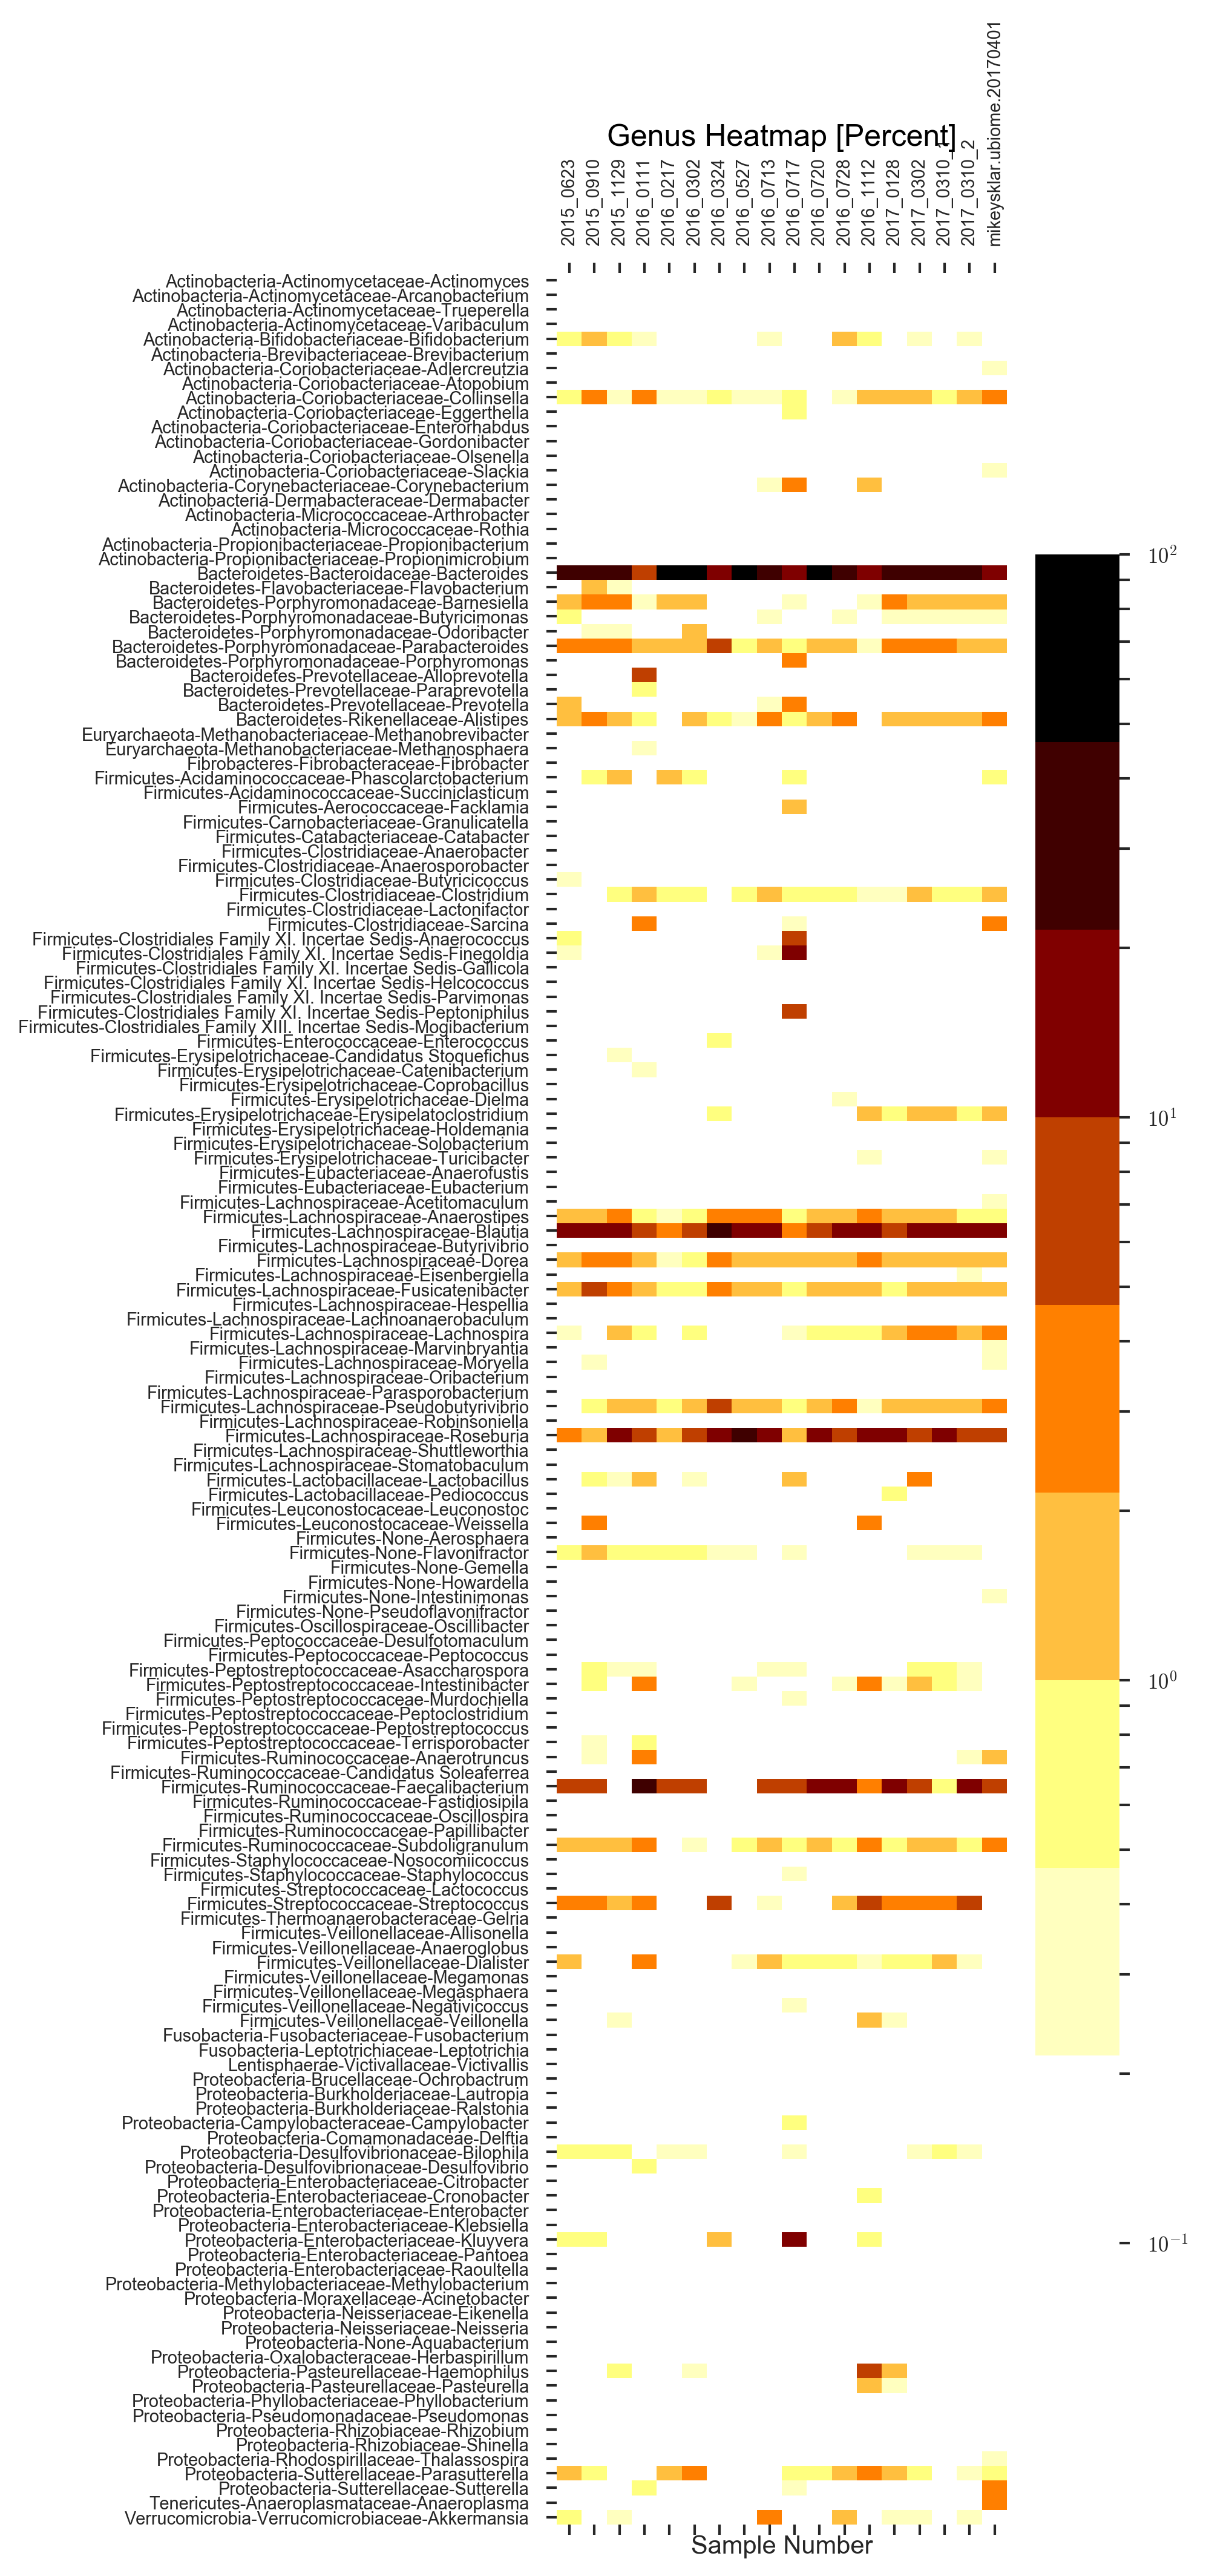
@Mikey_Sklar Here’s the same plot but colored differently. I also cleaned up the sample names on the plot. Shows the differences i little better i think.
If I had more time, I’d like to make a webservice where you can upload these ubiome json files it automatically makes the plots for you. Someone is free to make that though using my code