I have some minute-by-minute heart rate data from a smart watch and the history of different foods I ate with timestamps and would like to correlate the two to detect potential food allergies.
My idea was to determine the average heart rate for a specific timespan, e.g. 3 hours after the time I ate the food for each food and timestamp and then perform an analysis on this.
An issue to look for of course is, that some further factors, that can influence the result is the timing of the day, as the heart rate varies during the day and also the seasonality of food, e.g. if all eating occurences occur during a concentrated period, there is a higher probability, that the variation occurs due to some other variable of that period.
Any further ideas / risks to consider? Which kind of distribution would you suggest using for this kind of analysis?
I don’t understand the clinical value. A food allergy is important if the reaction is dangerous or causes unpleasant symptoms. If you eat something and it makes your heart rate change by 15-20 beats per minute and doesn’t make you feel bad, does it matter? On the other hand if you eat it and your lips swell or you get a rash or vomit, that would matter independent of heart rate changes.
Food does not typically radically change heart rate. If it does, you have a chemical or physiological reaction. Either eat less, slower or change what you eat. You see this in kids with too much sugar or with diabetes. The body cannot effectively deal with what is being put in. Note also that mental stress also changes heart rate, so this may also be. a factor.
The idea is based on a pulse test invented by Dr. Arthur Coca in the past, which states that your heart rate might increase in response to a food to which you are allergic. I know it is quite controversial, but on the other hand I think there can be some truth to it, as the body frequently reacts with an increased heart rate to stressors.
@LEF It all depends on the kind of allergic reactions. Of course a swelling or vomit reaction is a more unpleasant reaction, that an increase on heart rate. However there are some intolerances, that are hard to notice immediately or would require a high degree of mindfulness, like a slight stomach irritation or even a slight headache during the day, which eventually can negatively impact your focus or productivity. Also due to the mix of foods you have the increased complexity of isolating out one.
In these cases I think statistical methods based on different variables, that can indicate allergic reactions could lead to more insights.
An example I discovered recently is, that my body has a slight sensitivity to eggs. I always had a suspicion, that my stomach is irritated the day after eating eggs, but never took it too seriously. However after performing some correlation studies with sleep data recently, I was able to discover that eating eggs impacts different variables, like heart rate, restlessness, number of awakenings in an adverse way.
So with the test mentioned above, I hope to discover more effects like these. It might not be 100% accurate, but the attractiveness is, that I can collect the heart rate data completely passive and as for the tracking of meals, I already do as part of tracking my caloric intake.
You have to adjust for many other factors but with a lot of data and in the same person some will cancel out. These may include sleep times, sleep quality, dreams, time you went to bed, weather, season, day of the week, skin conductance level, exercise, activity, social factors, other stress measures, other food and mealtimes, bowel movements, how much you are working, temperature, medication, attitude, and a bunch of other factors. There is a lot of literature and evolutionary arguments that suggest that intermittent fasting is healthy. Intermittent fasting also seems to affect BP and HR. It may be that the tail is wagging the dog.
I like this idea. A long time contributor to the QS Community, @azure, who led our PLR project on cholesterol, has a useful metaphor for these kinds of tests. (She applies it to body temperature, but it is equally suitable for HR.) She compares using general systemic value like temp or HR it to listening to an orchestra concert from outside the hall. The sound is muffled, and you might not be able to hear individual sections clearly or even easily know the exact piece being played, but by noticing the volume and rhythm you can still learn a lot.
I’d like to suggest a few really simple approaches to testing your idea. At its root, you have a guess that eating certain foods will affect your HR, and that increases in your heart rate go along with other negative reaction to certain foods. I think the first thing to do is to evaluate your heart rate data and get a sense of the typical range. There are more and less rigorous ways to do this, and I don’t want to dive too deep, thinking you probably already have your own ideas about this: whether you want to set the range with a statistical test or simply by eyeballing a graph matters less than doing this preliminary work of setting your expectations. Then, with a typical range in mind, you want to look for cases of variation outside the typical range, and see if these represent something more generally negative. To do this, you probably also want to do some kind of tracking of your wellbeing. (The simpler the better.) This phase will give you a better sense of whether your intuition — HR outside the typical range signals something bad happening — is worthy of confidence.
This should only take a few weeks, unless you very rarely see incidents of HR out side the typical range. (In the case of little meaningful variation, you’ll probably want to abandon the food/HR experiment, because you won’t expect a signal.)
If you do see cases of variation outside the typical range, and you have a sense that these go along with symptoms or decrease in wellbeing, then you can start to think about designs for researching the impact of food, and then of specific food.
I say all this without really knowing what you’ve done so far, maybe you are past this step?
What I had done so far was creating a dataset of over around a year of different foods I ate and their timing. In addition I collected minute by minute data of my heart rate through a headband.
So my thought was to use this data to derive some information on the heart rate effect of different foods.
My first attempt on evaluating the data was to compute for each occurrence of a food the average 2 hour heart rate during the period before I ate the food and the average 2 hour heart rate during the period after I ate the food. So I get a list of data points, where each data point consists of the name of a food and the corresponding increase / decrease in average heart rate. An advantage I noticed about this heart rate difference approach is, that it eliminates a lot of noise, like variation of average heart rate during that day due to weather, general stress level, etc.
After some google searching on the best data analysis method, I decided to perform an ANOVA analysis with python (food as multi-category independent variable, heart rate difference as a continuous dependent variable). With this method I determined a p_value of 0.000978. This indicates some statistical relevance in the entire dataset, however in itself doesn’t tell much, because it doesn’t give any hints on which specific foods actually produce a statistically relevant difference.
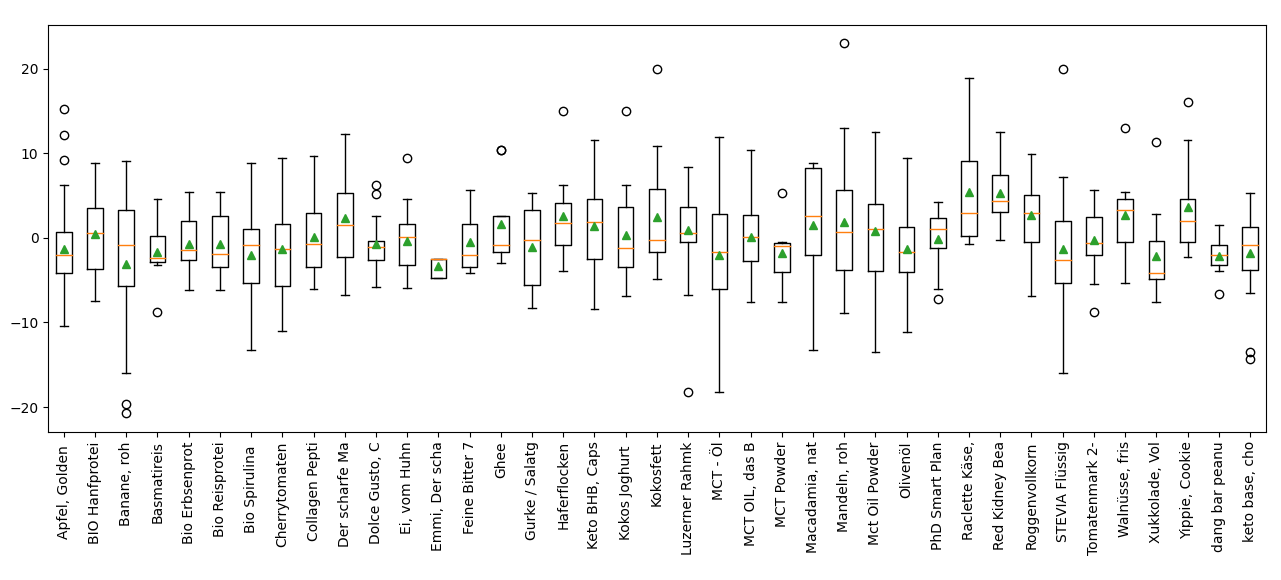
For this I decided to create a boxplot and also perform a pairwise analysis on the data. The boxplot looks as follows (with the green arrows indicating the mean heart rate difference, x-axis name of the food and y-axis the change in heart rate bpm):
As can be seen in the chart, the biggest difference occurred with “Red Kidney Beans” to an average increase of around 5 bpm. Incidentally, this is a food, to which I had discovered a sensitivity before, after performing a fodmap elimination diet. (The other food “Raclette cheese”, which produced about the same difference is due to a dependency effect, as I ate that food sporadically with the kidney beans and never with any other food).
A Tuckey honestly pairwise analysis determined a statistically significant result only for the pair banana - red kidney beans (-3bpm to 5bpm).
Based on this result so far my first conclusion is, that his kind of analysis can derive some meaningful indicators and I am looking forward to collecting more data over time.
Looking forward to your comments / feedback, as I am sure there are things I overlooked while applying this analysis. One thing to keep in mind of course is, that the ANOVA assumes that the categorical variables (in this case type of food) are independent variables, while in reality some kinds of food occur in combination with others. However, I think incorrect results due to this can be excluded during interpretation.
Thank you for sharing.
I am wondering why you chose a two hour pre post average. My assumption would be that an allergic reaction to food would occur within 15 minutes of consumption. The two hour post consumption period may be picking up the secondary gut fermentation process. In that light have you considered refining your food categories into the specific FODMAP categories and then looking at heart rate changes due to those specific categories and moving the start of the post sample window out 30 minutes to detect gas formation?
I chose a more prolonged time period due to inconsistencies in tracking of the meal timing (sometimes beginning of meal, sometimes end of meal). For this reason I also decided to cut off the first 20 minutes pre / post meal event. Then I experimented with different timespans, e.g. 1 / 2 / 3 hours and got similar results for 2 / 3 hours, while for the 1 hour time period I didn’t get any relevant results. So I guess that would match your assumption, that the results only captured the secondary gut fermentation process and no actual allergic reactions? I am wondering now if one can even speak of an intolerance in this case or if its just an increased heart rate due to the ongoing fermentation process?
Which time point would you recommend as reference for detecting a 15 - minute effect, beginning or end of meal?
I haven’t thought yet of the grouping into different FODMAP categories, but sounds like an interesting thing to try.
I performed a similar analysis with the Tukey Honestly Test, which basically does a t-test analysis for each pair of all possible pair of foods (in addition to some adjustents to reduce the risk of getting signtificant p-values by chance due to the increasing number of regressions). In that case only the relationship banana vs kidney beans proved statistically significant (mean -3 bpm vs +5 bpm).
I just want to note that I’m inspired by the thoroughness of this approach. It definitely produces analytical complexity, but in reading the dialog it seems like this complexity is handled with skill. I think the discovery that red kidney beans may be a cause of problems is important, because the only other way I know to do this is through an elimination approach, which is burdensome. In your case, the fact that the HR analysis indicates the same possible cause as the elimination diet is definitely confidence building. Just some cursory reading via Google Scholar shows some interest in the relation between beans and microbiota; mostly looking for/at positive effects on health. I didn’t have time to read these results, only the abstracts; but @OP_Engr’s idea that the effects may be related to fermentation might lead you to look into some of this material.
I don’t have specific underlying knowledge of the body’s response to allergens. I assume it is dose and duration dependent. I am used to the 15 minute number from flu shots (which is an impulse exposure). I would time from the end of the meal since I assume the attack and decay times for the response are significantly different (recovery taking much longer).
That’s always nice to hear. I also liked about the approach that it creates the possibility to derive adverse effects across different foods without requiring any dietary restriction. But HR data also provides many challenges as mentioned in other threads. I will keep up the tracking and see how the data evolves over time.
That makes sense, I think 15 minutes should be enough to trigger a reaction in the body. I will have to overthink my meal tracking approach to see if I can reliably track the end of each meal with the required minute-accuracy.
Why did you compare a pairs of food? If we looking for allergy maybe we should compare average HR for all food versus certain food? To find out what lowers/increases HR vs average meal.
Did you check data distribution before doing a t-test? A lot of data will not pass t-test requirements making t-test results not just useless, but pointing us to wrong conclusions / decisions.
Did you adjust your p-values for multiple comparisons? If you compare a lot of foods, even a statistically significant difference may be just random noise.
On the boxplots you have posted 40 foods compared with HR. There is some multiple comparisons and p-values might be adjusted (if you didnt) and may reveal +5bpm difference is not significant.
I have 4 months of 1-min HR and full diet data and will try to analyse it.
Sounds very interesting. Can you post results of your analysis? I’ve did some by myself with dreem eeg, oura ring, fitbit and found that wristworn wearables can only measure 1 sleep measure accurately - time in bed… awake time & count, sleep stages, sleep latency, reslessness (oura) was totaly inaccurate and useless and i’ve throw away correlations versus totally inaccurate data i’ve found…
Also, when i’ve discovered that i need to adjust p-values for multiple comparisons (oops) - most of connections i’ve found disappeared…
I followed mostly the guide on this website for performing the analysis: One-way ANOVA with Python
The site suggests 3 methods for determining correlations after the ANOVA and they are all pairwise. I guess an issue can be, that if you compare each category to the average of all other, you get too imbalanced data-sets? Like comparing 10 positive with 1000 negative points. Don’t know if that is an issue.
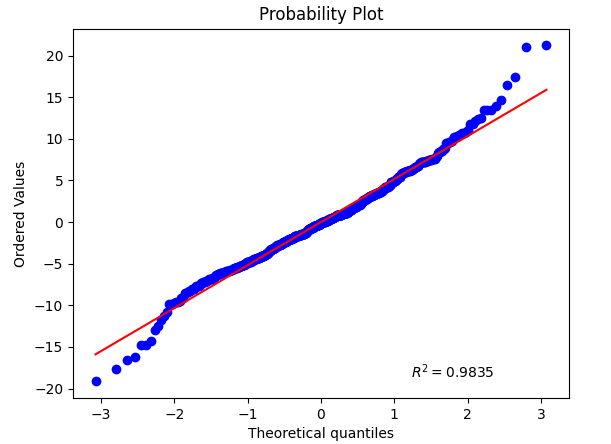
I did some distribution analysis as suggested on the website, although admittedly I have been a little bit lax here. For the normalcy test, I got the following probability plot for the model residual:
The plot shows that most of the data follow the normal distribution, but there are some deviations in the two ends. Also the R2 value is little bit below the required value for the amount of data points (500+). On the other hand the website suggests that for high enough data point count one can still rely on the central limit theorem for the normalcy assumption.
For the homogenity test I did only a visual check of the box plots and while to size of the box plots looks similar for most variables, there are also some outliers in both directions. I didn’t try a quantitative approach here, as I have noticed from other tests, that they almost always give bad results for a high data count.
3-4: The Tukey-Honestly analysis that I used here already performs an adjustment of p-value to the number of comparisons.
Regarding sleep data I had the same observations so far. I relied mostly on dreem for the sleep phases and if I remember well, just took HR and HRV from oura. I had done in the past some correlations between dreem and oura and found that there is no correlation between deep sleep duration. The total sleep duration had some correlation and then light and rem sleep durations had some correlation, but that could also be just due to the fact that light and rem sleep duration are proportional to total sleep duration. I guess if someone looked at the exact timing of rem / light sleep phases they would also be mostly off for oura. I will post my results here as soon as I get to it.
My idea was: if we assume that only few types of food cause some HR response, then if we take average HR for all meals it will be average normal postprandial HR. The we compare all types of food with average “normal” to find significant deviations and investigate them.
thats correct. My dreem 2 and oura hypnograms are totally different, and i’m assuming oura pretty worse at sleep staging (even awake time).
i didnt find any data which support this statement… Did you find anything that proves this by using scientific method?
Did you use all HR points or just resting HR in your analysis? By resting HR i mean excluding some HR points when activity were present. Moving / standing and other activities will cause acute changes in HR. After reading Mikes Snyder publication about HR and disease detection i’ve seen that they exclude all HR points with steps > 0 for a previous 10 minutes to get resting values.
I think tracking heart rate data to detect food intolerances is an interesting approach, especially since minor reactions can be hard to notice right away.
I’ve had similar experiences where certain foods caused subtle issues like bloating or brain fog, but it took me a long time to make the connection. I used to just shrug off my occasional headaches until I started keeping a food journal and realized dairy was a trigger for me.
There are some great resources on how to distinguish between allergies, intolerances, and sensitivities. I found this guide: https://mfm.au/digestive-health/food-sensitivities-allergies-intolerances helpful breakdown on food sensitivities, allergies, and intolerances that goes into more detail on how these reactions work.