Recently installed a Pi-hole on my home network, and I’m thoroughly enjoying the tool. But it struck me today that the Internet usage data being collected by this computer could be extremely useful for tracking my own behavior in general. And then simply graphing data points to see what becomes obvious.
Here is a screenshot of the “long-term data” that has been gathered so far from my device.
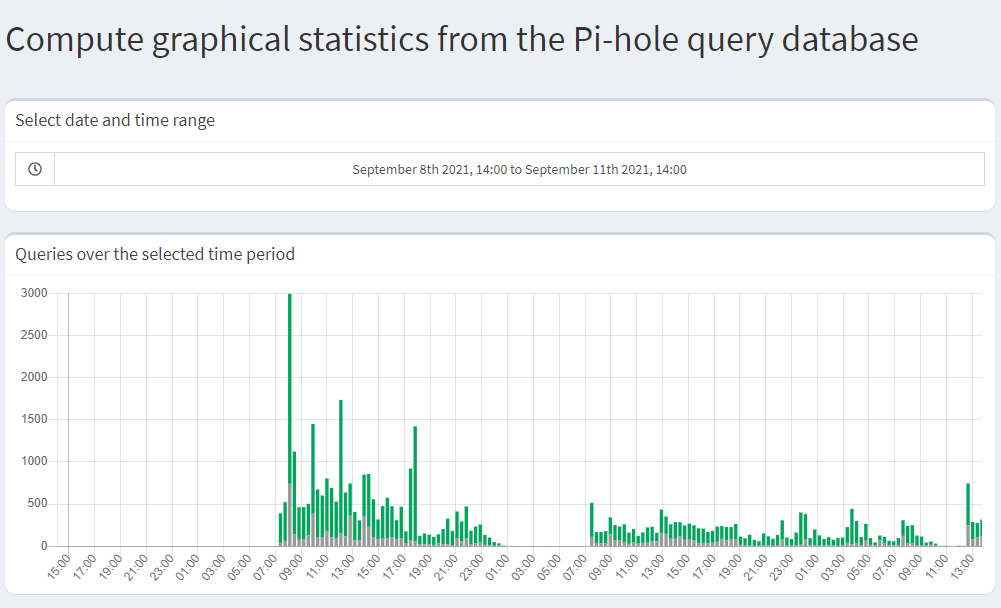
After doing more research into how the Pi-hole data is being stored, it seems that I could simply export a SQL DB and have access to granular information about when, where, why and how I visited certain websites. As well as the volume of requests, associated IPs and much more.
This post might as well be #001 for this interesting research project, as I suspect I’ll be returning to the idea of using a Pi-hole DNS device for gathering (essentially) my entire lifestyle Online, and then analyzing the data for trends. If I’m correct, the potential(s) here is strong.
Can you explain your experiment? Experiment isnt just about collecting a data. It’s about formulate a question / idea at first. What question you want to be answered? If answer doesnt lead to decisions, that’s not too much about QS, it’s just collecting data for fun…
Also there is a lot of questions raise as you start experiment: How much data to collect? Do i need to blind myself? What’s best accurate/convinient way to measure variable of interest? What’s effect size i’m looking for my outcome variable? How to analyse collected data? Do i need to take out outliers? Can i use correlation or regression analysis on my data? Do i need to account for multiple comparisons? etc
I should not have originally described this research project as an “experiment”. My interest in tracking personal Internet usage data isn’t about formally experimenting using the scientific method. This undertaking is ultimately about growing my mindfulness practice as a Technologist.
@bretbernhoft I didn’t know much about the Pi-hole, so I did a little reading and found this post, which gave me a small window in the data that’s being stored and could be analyzed. : Pi-hole: 3 years later.
The information being tracked (as far as I’m aware) includes IP address(es), client data, IPv4 vs IPv6, domain(s) queried, status, replies and actions. So there’s a bunch of data automatically being tracked by the Pi-hole that any user/owner of one can work with over a given period of time.
With that said, it will be interesting to see which websites I will visit and when, graphed as a bar chart with volume over time.
@Connor_Parish, the most important insight I can offer is to simply ensure that you have “logging enabled” on your Raspberry Pi device. This might sound mundane, but not doing so was a mistake I made a couple of times while experimenting. Similarly, make sure that you have a reliable power source for your Raspberry Pi, as the device is quite sensitive to interruptions.
Depending on your objectives and how much data logging you’re planning on doing, it would be wise to be intentional about the number of domains that you keep/maintain in your blocklist. As that variable will determine the outcome(s) for many your other datapoints.
It’s also important to be somewhat familiar with how a computer network operates. I’d assume that you already have some knowledge of LANs, but in case you don’t, here is a video that introduced me to the basics:
I hope this information helps you in your Raspberry Pi (Pi-hole) project. If you have any specific questions about how to accomplish anything, feel free to ask here. I am happy to provide whatever insights I can. I hope you are successful in your efforts. Have fun!
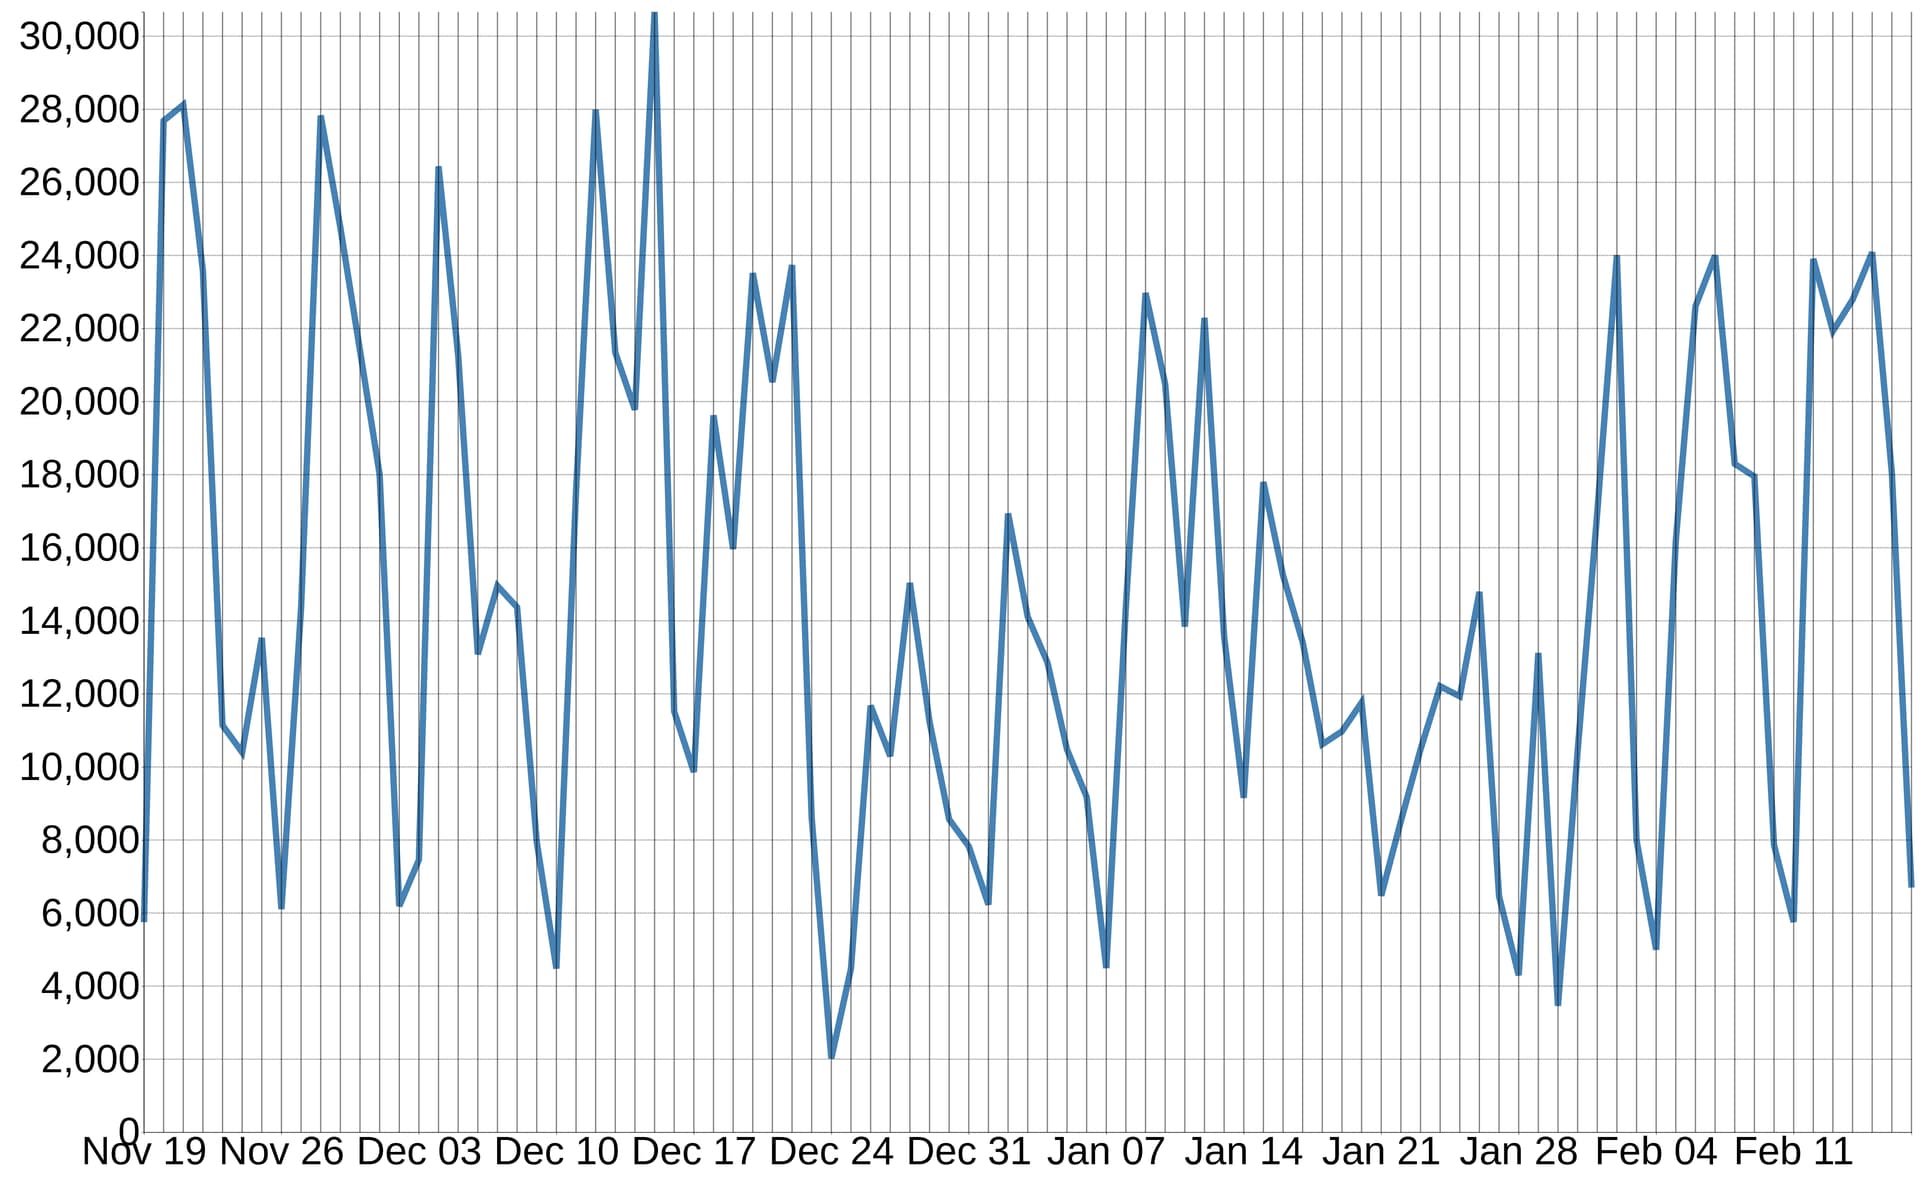
This is the beginning of a weekend long project. I just downloaded 91 days of DNS queries from my Raspberry Pi installation of Pi-hole. 1,327,709 in total. That is what you see displayed above; the relative query volume beginning on November 19th, 2023 up until today, February 17th, 2024.
As a result I have 150 MB of data to process and analyze. And, if it’s cool with everyone, I would love to continue sharing the results. The potential for self-quantification here is rather intriguing.
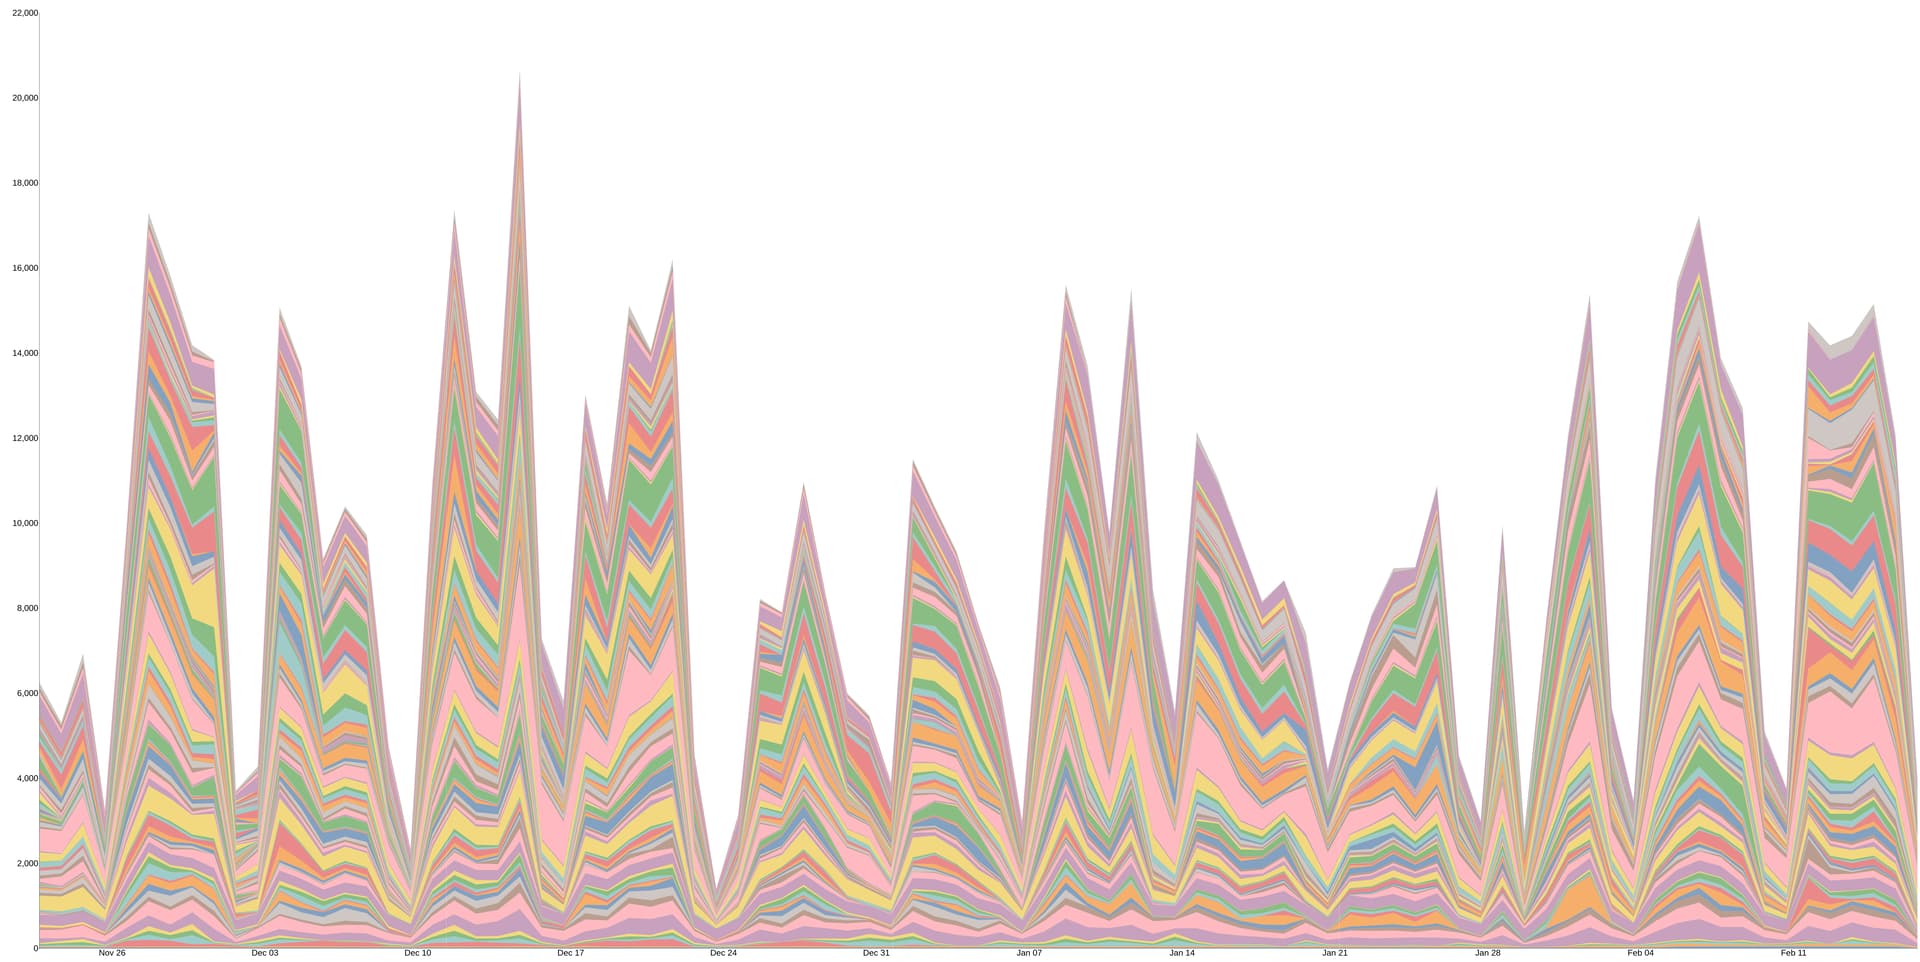
This visualization is similar to the other graph that I shared earlier/above. But instead of being the total DNS queries for a given 24 hour period (over 91 days) as a single line, we’re looking at a streamgraph featuring the number of DNS queries made for the top one hundred TLDs during the same time frame.
I’ve quickly reached a place with this self-quantification project, that I am now focused on making all of the tools I’ve built available in a repo on GitHub. When that is available, I will share a link to it here.
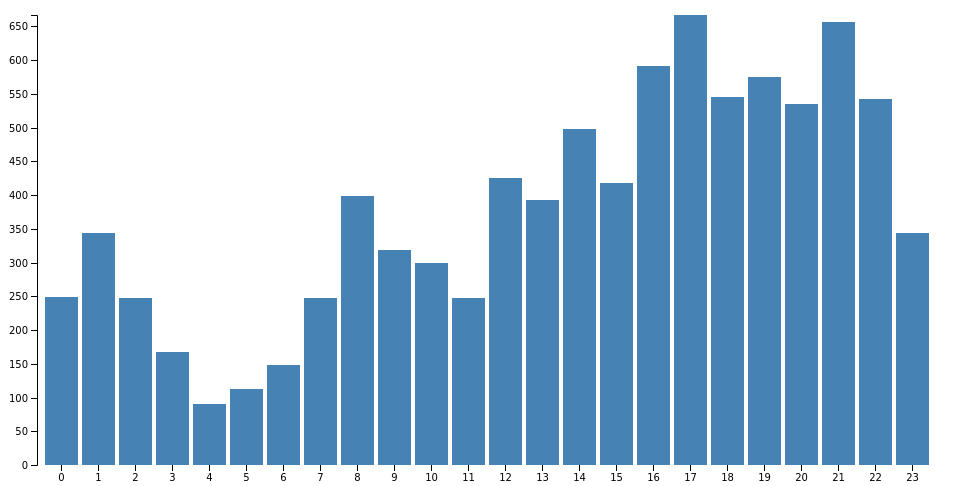
And as one last data visualization, here is an example of the most popular hours of the day, at which I have visited one of my favorite websites.
Hello @Heikophilo. Thank you for your interest in this little project.
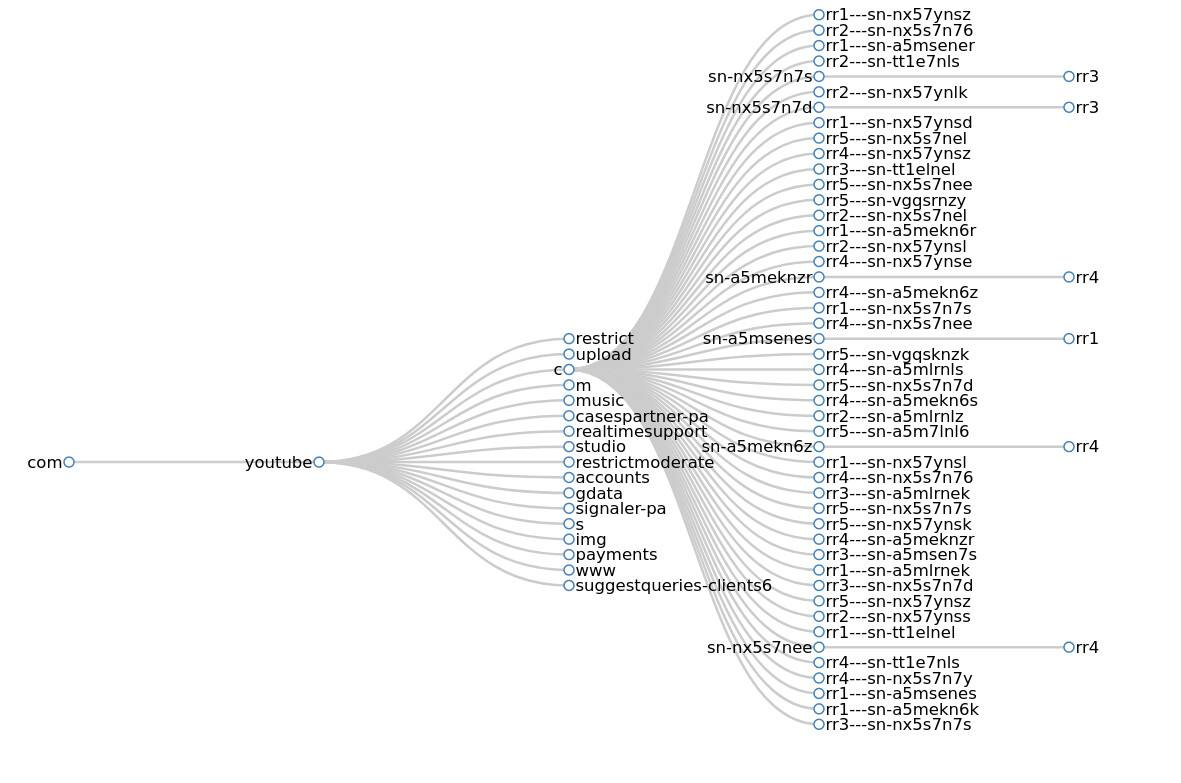
I have all sorts of visualizations, based on the original data I downloaded last Friday. Here, for example, are all of the YouTube subdomains that I have visited over the past few months.
I am interested in people, including myself. I learn a lot about myself by observing what I do and like to do. In this vein, I would be curious to know which topics you were most interested in. That would require mapping your visits data onto a librarian´s scheme or an ontology - which is quite a hard problem.
My impulse is to give DNS queries some meaning.