I am restarting a prior discussion (See [Percent Composition of Weight Loss: Fat vs. Muscle vs. Other Lost]), having improved my analysis of body composition.
Background: Back in June 2018 I was asking for help identifying “other” weight loss. The problem was that, given an impedance scale reporting weight, %fat, %muscle, and %water, where %fat + %muscle + %water > 100%, I chose to ignore the scale’s %water and instead used the formula weight = fat + muscle + other, where other included skin, bones, organs, etc. But, since my calculations showed only about 2/3 of my weight loss was fat, and about 1/3 was “other,” then clearly a loss of “other” couldn’t actually be a combination of loss of skin, bones, organs, etc.
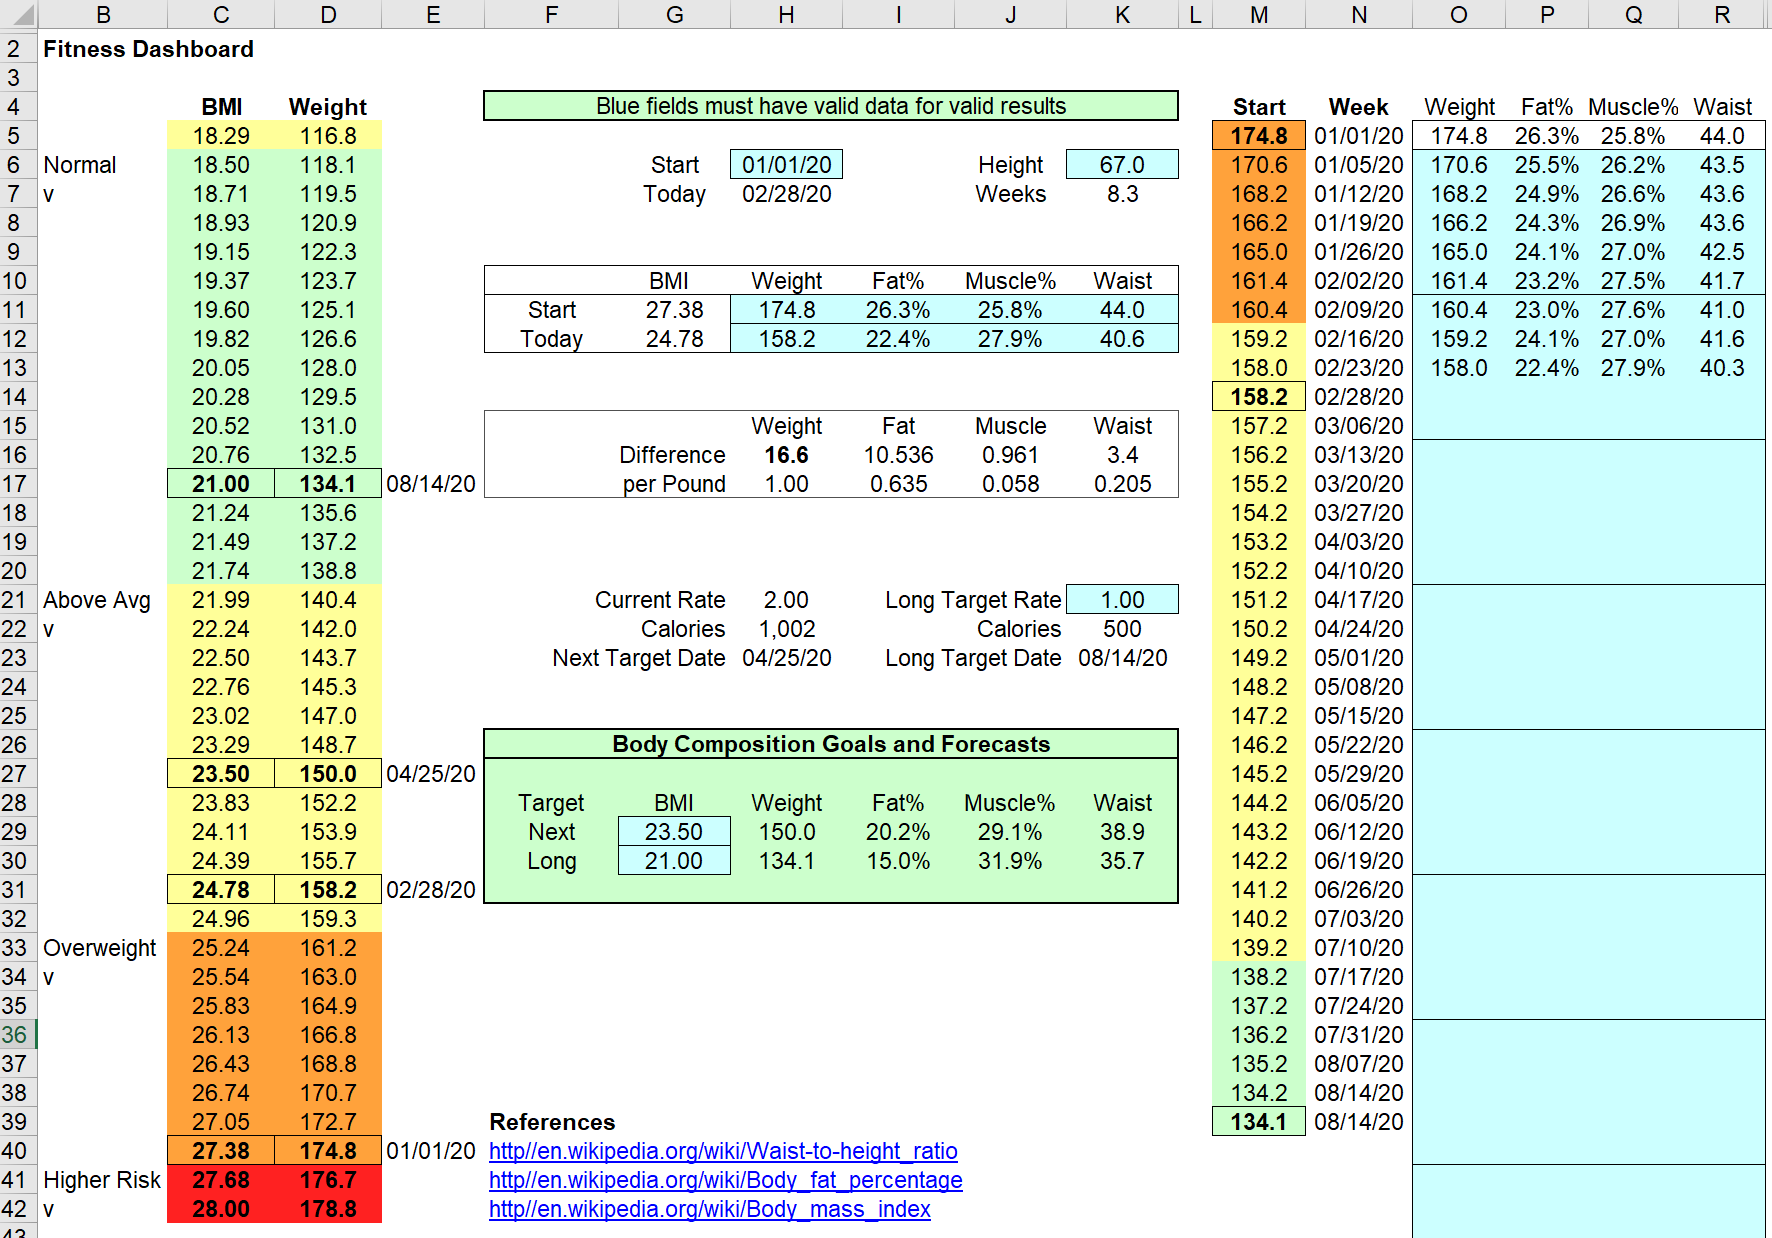
Fast forward to today: Having regained weight back up to 174.8, I restarted my diet and exercise on Jan 1, and today Jan 25 I have gotten back down to 157.8. Now I’m redoing the prior analysis previously discussed in the above link. This time, instead of ignoring the problem that calculated fat + muscle + water >> weight, I focused on the before vs. after delta results of the calculations for fat, muscle, and water pounds.
With some surprise that I had missed such an easy resolution, it turned out that calculated water loss is almost exactly equal to calculated “other” loss; i.e., the difference is well within any expected rounding errors given the limitations of the impedance scale technology. This might be a coincidence, but is more likely to be a calibration / validation constraint within the scale firmware so that any total of fat, muscle, and water gain/loss will be equal to weight gain/loss within the rounding error.
So, with apologies for single decimal rounding errors, here is a snapshot of the revised spreadsheet calculations for current data:

While actual numbers still depend on the accuracy of the impedance scale technology (currently a Weight Gurus 0375) that only uses foot pads, I expect there would only be a few percentage points difference if I invested in an upgrade to a scale that uses feet and hands together like some of the Omron and InBody models.
The bigger picture going forward: Now having an analysis I can trust, regardless of the exact numbers, I have a methodology for predicting future progress, answering my favorite two questions regarding my future weight target (134.0 pounds for a 21 BMI):
Q. "Given that my %fat is pretty poor at 22.2% today, but getting better since Jan 1, what %fat can I hope to get down to at my target weight (assuming no change in my diet or exercise program)?”
A. %fat at 134.0 = (35.0 – 63.8% * (157.8 - 134.0)) / 134.0 = 14.8%
And,
Q. “Given that my %muscle is pretty poor at 28% today, but getting better since Jan 1, what %muscle can I hope to get up to at my target weight (assuming no change in my diet or exercise program)?”
A. %muscle at 134.0 = (44.2 - 5.3% * (157.8 - 134.0)) / 134.0 = 32.0%
Both of those results make a lot of sense in the context of extended research on healthy target fat and muscle, so I am feeling quite good about these estimates.
And, if I put substantially more effort into avoiding the 5.3% muscle loss per pound of weight loss – for example gaining 5.3% instead of losing 5.3% – my %muscle might get up to a better number like 34%, and my %fat might get down to a better number like 13%.
Comments?