Lifelogging
Map of life
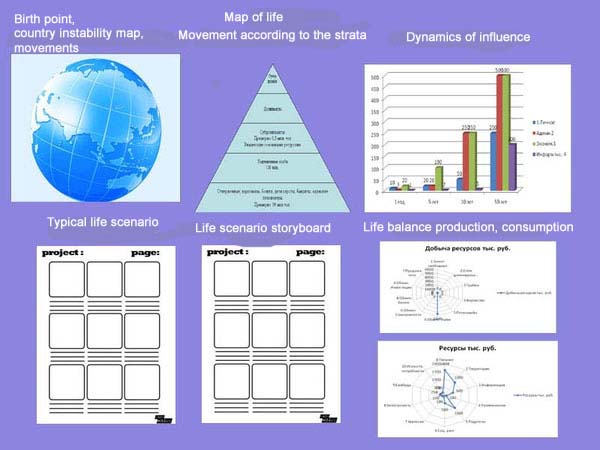
Infographics. Human life
How can you graphically and objectively reflect a person’s entire life as accurately as possible?
This is the view approximately 2010.
-
Point of birth on the map of instability of countries and degree of freedom - routes of movement around the world.
-
Point of location in the strata of society and vector of movement across strata.
-
Dynamics of influence (quantitative audiences): personal, hierarchical, economic, informational.
-
A typical life scenario and its storyboard based on 24 main psycho-frames of life (Very important events).
-
The actual scenario of life. The main events of life.
-
Life balance in the form of “radars”.
What resources were extracted and by what methods?
What life programs were the extracted resources spent on? Start - finish.
Perhaps another graph of the rationality-emotionality of life is missing?
The ratio of how long a person stayed in the virtual (spiritual world) and in the world of practical rational actions.
The purpose of such a map is to more clearly represent the course of life, predict and, to some extent, manage.
Example
Sketch of the drawing

Related records
Measurement of instincts through personal finances. Personal driving forces of behavior