Hey QSers! I few months ago I posted about an idea for a Quantified Self application platform here. Turns out I actually made a prototype of this idea.
Right now I have a web app online that I’ll show you via screenshots. Since the idea involves QS developers (that’s you) making apps/analyses for the platform and many of you here showed some interest and, I believe, see the bigger picture, I’m hoping some of you will be interested in testing, experimenting, and just playing around being curious and having fun with the platform and sending me some feedback on how to make the platform better and more useful.
(Keep in mind this is a prototype.)
For Users:
After logging in as a normal user, you are taken to your dashboard where you can view your connections and your favorite app/analyses.
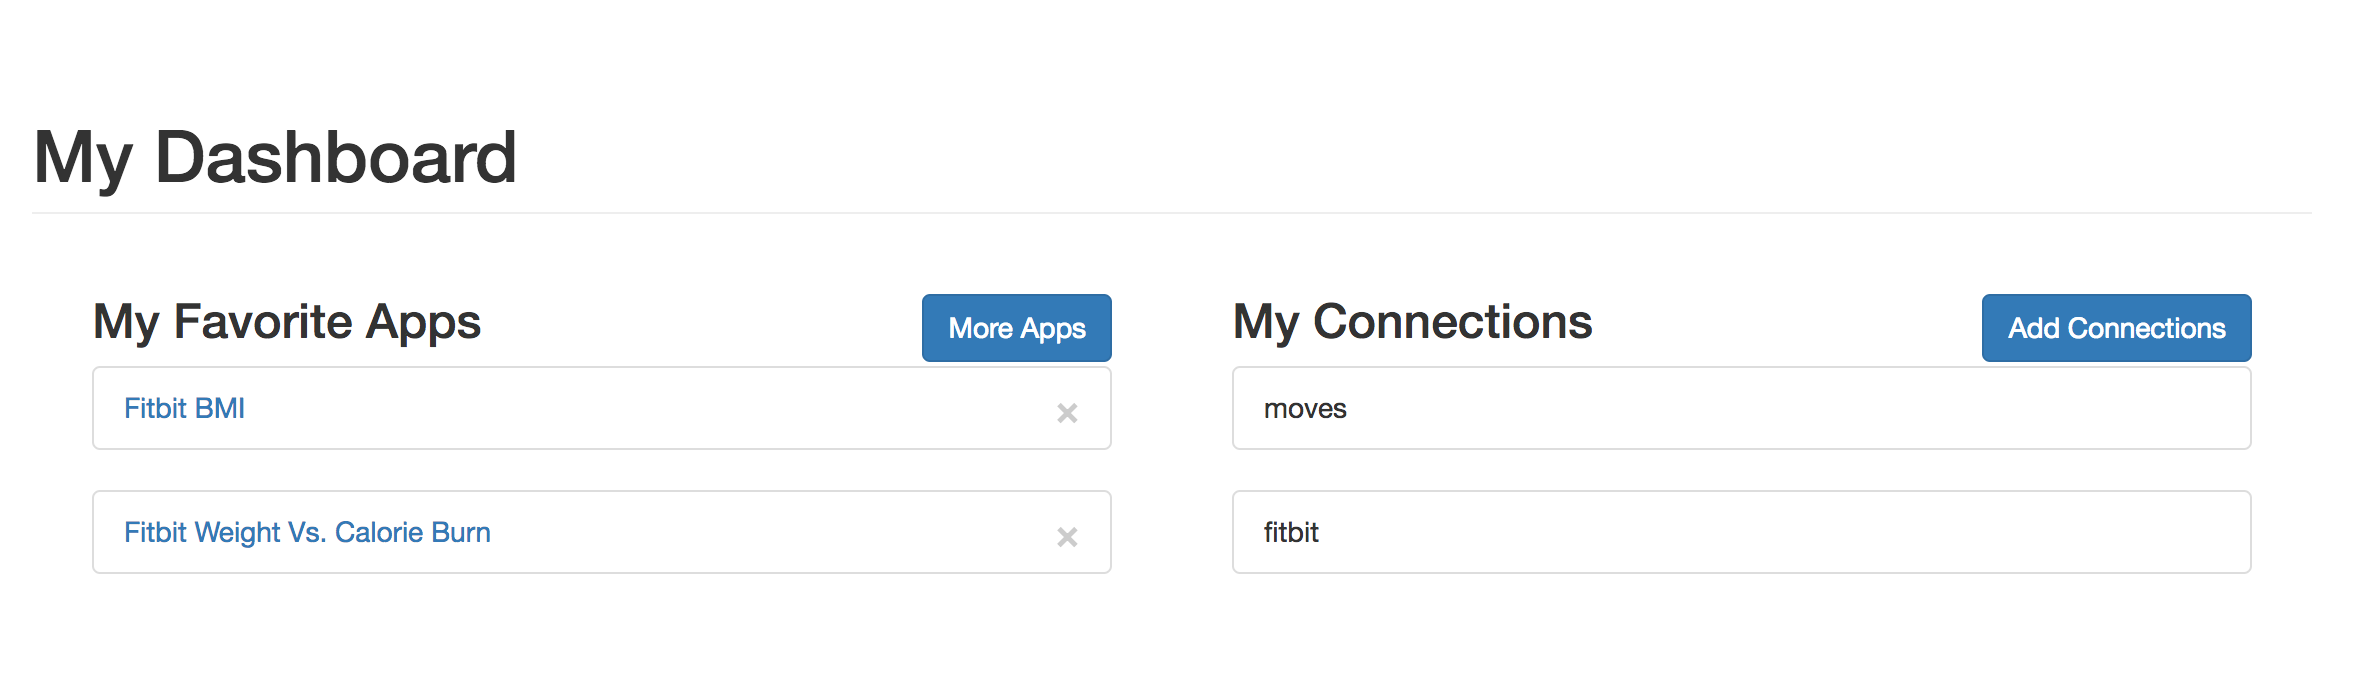
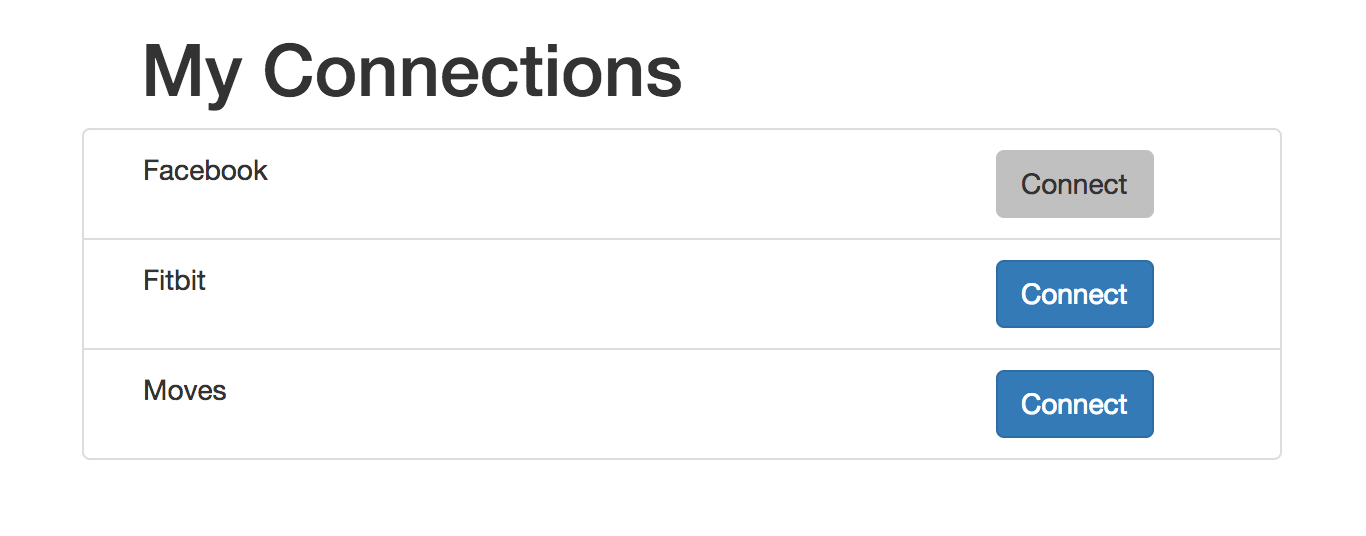
You can establish more connections… (right now just Moves and Fitbit, but soon more)
…or view more apps/analyses available on the platform…
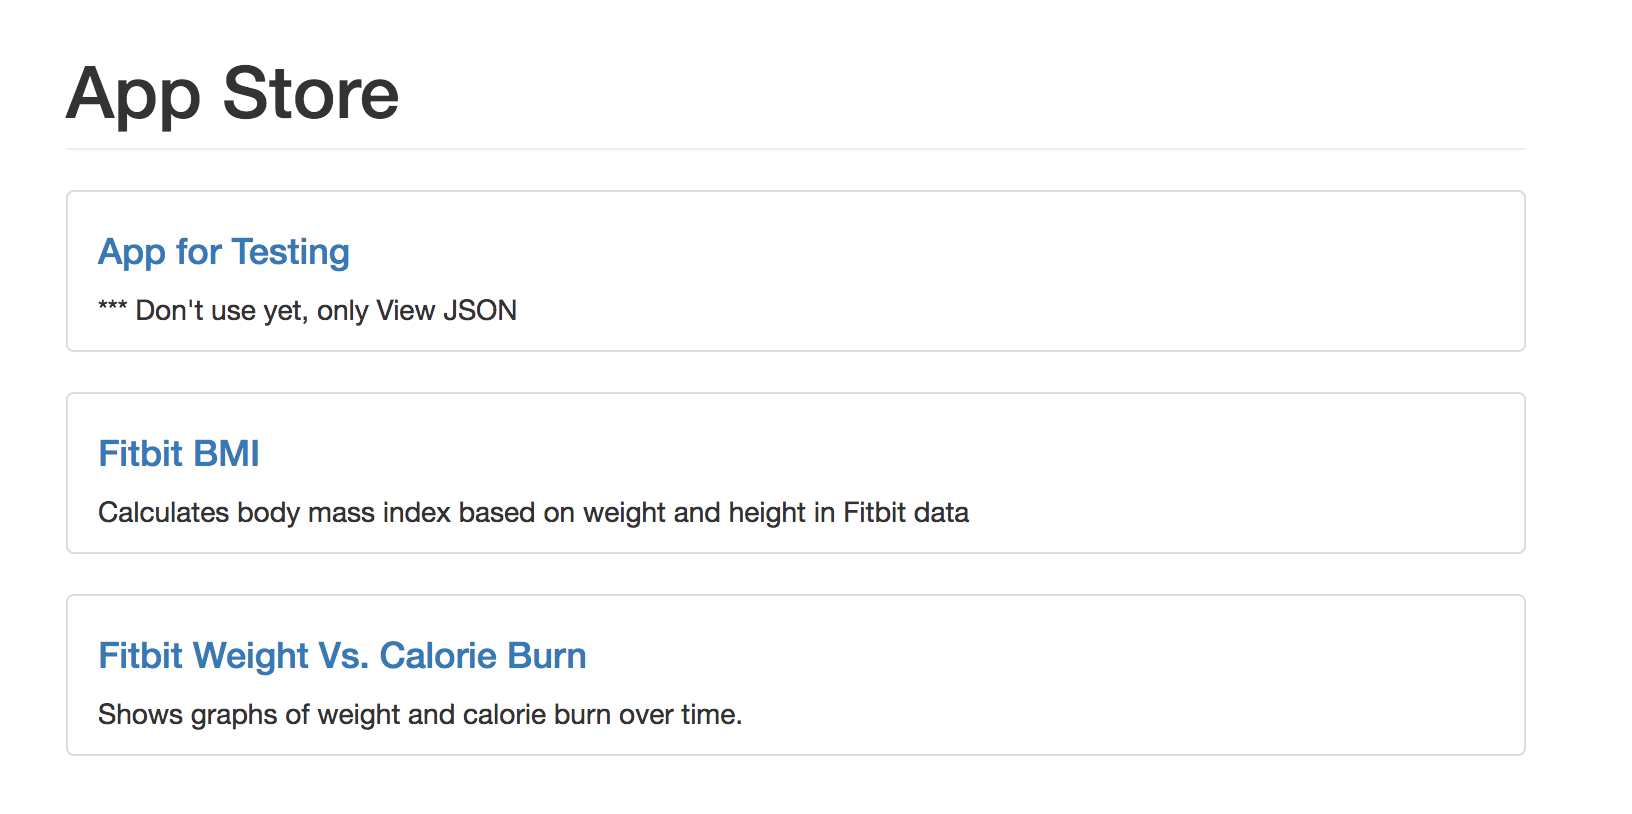
…and add them to your favorites to use.
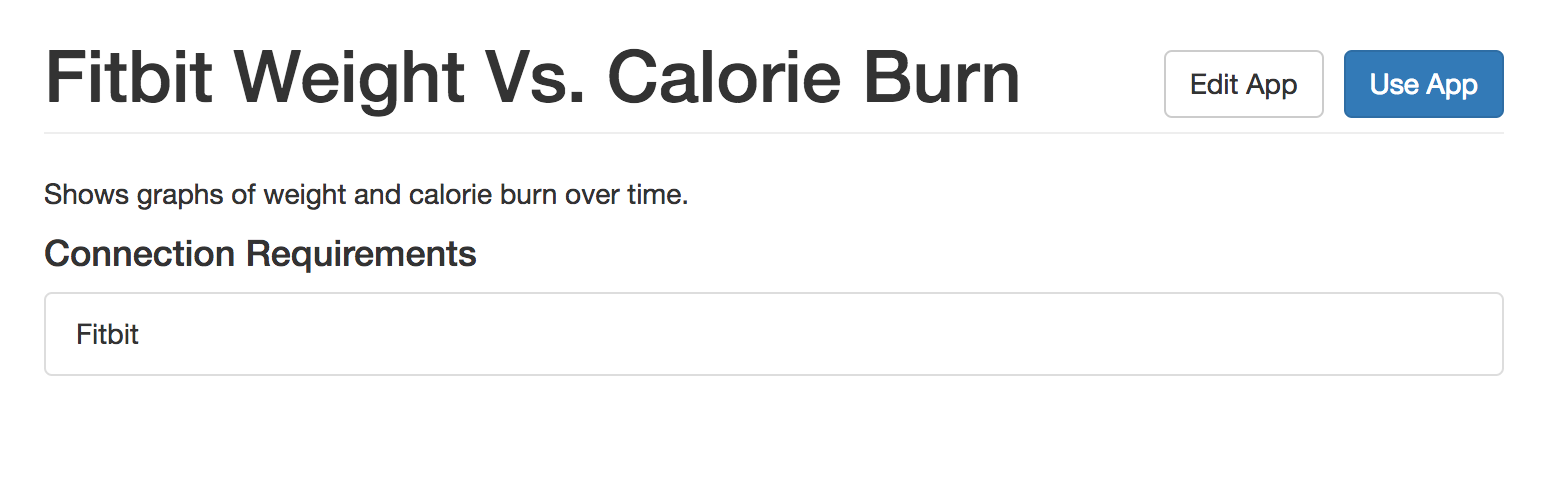
Here is an example of an app/analysis:

For Developers:
To create an app the developer needs to specify a name for the app, the Github repo where the source code is located, and what connections it requires to run.
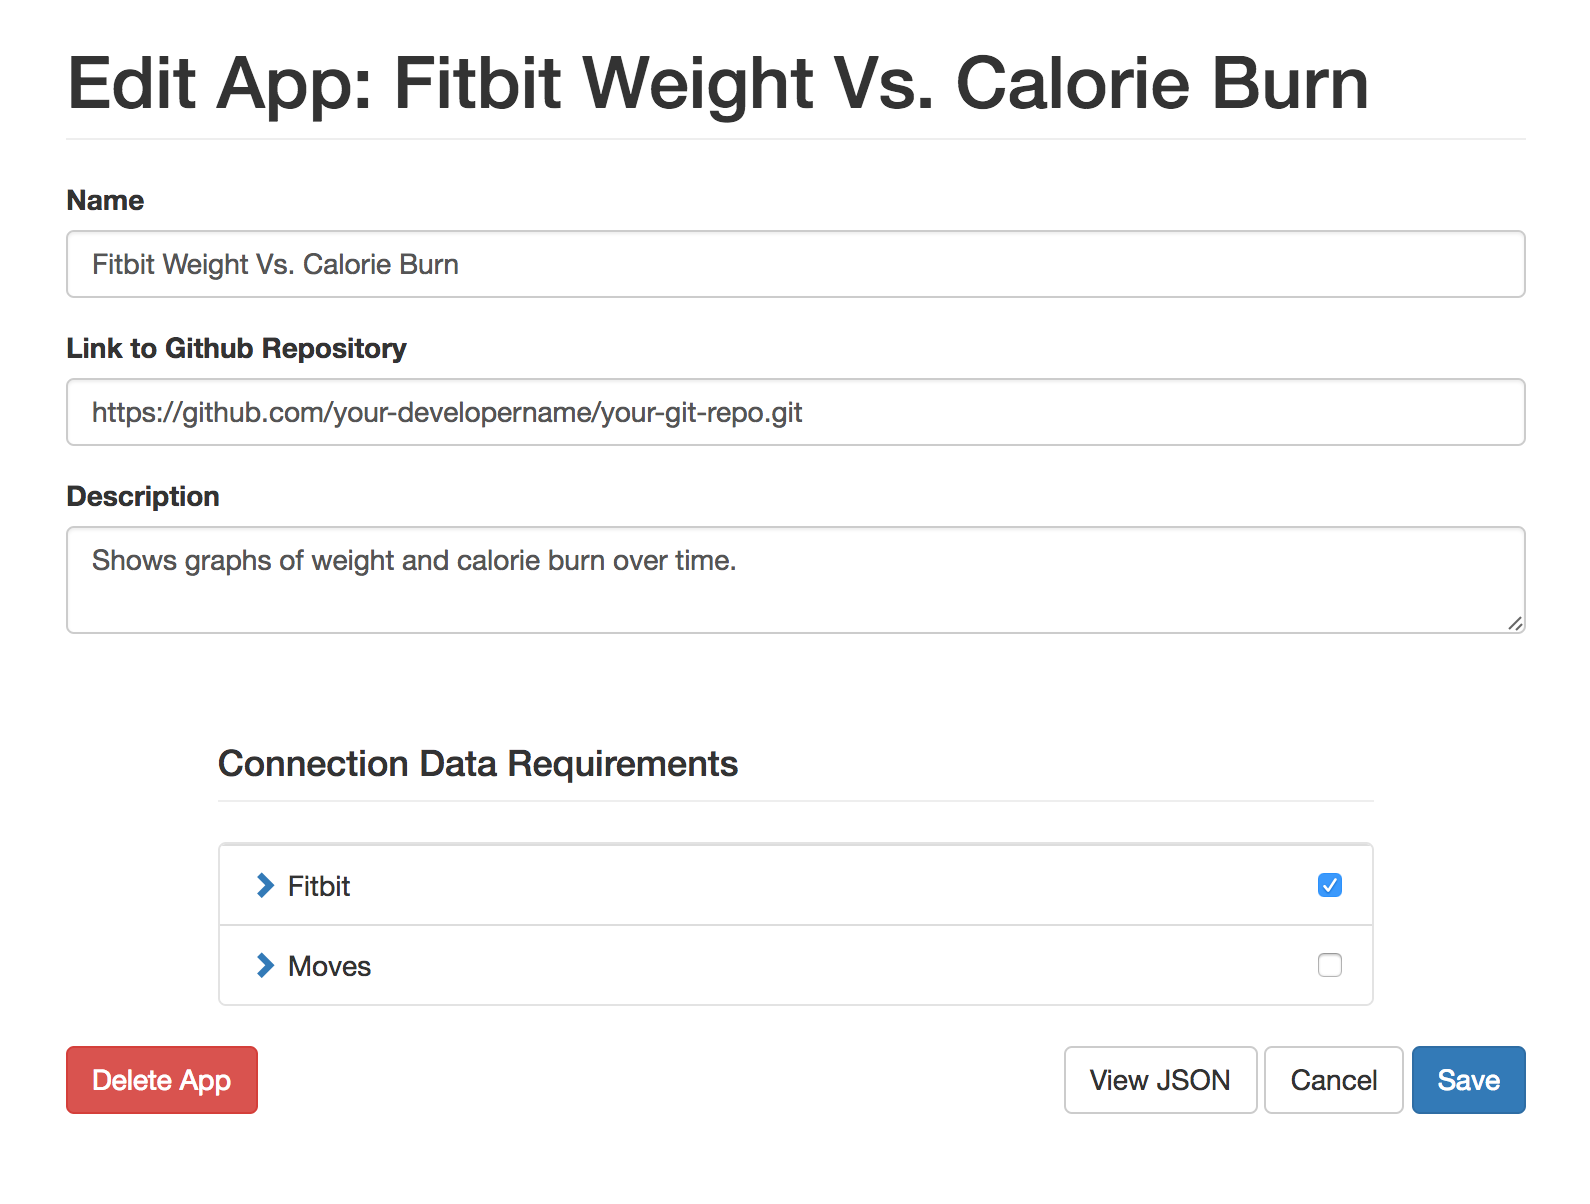
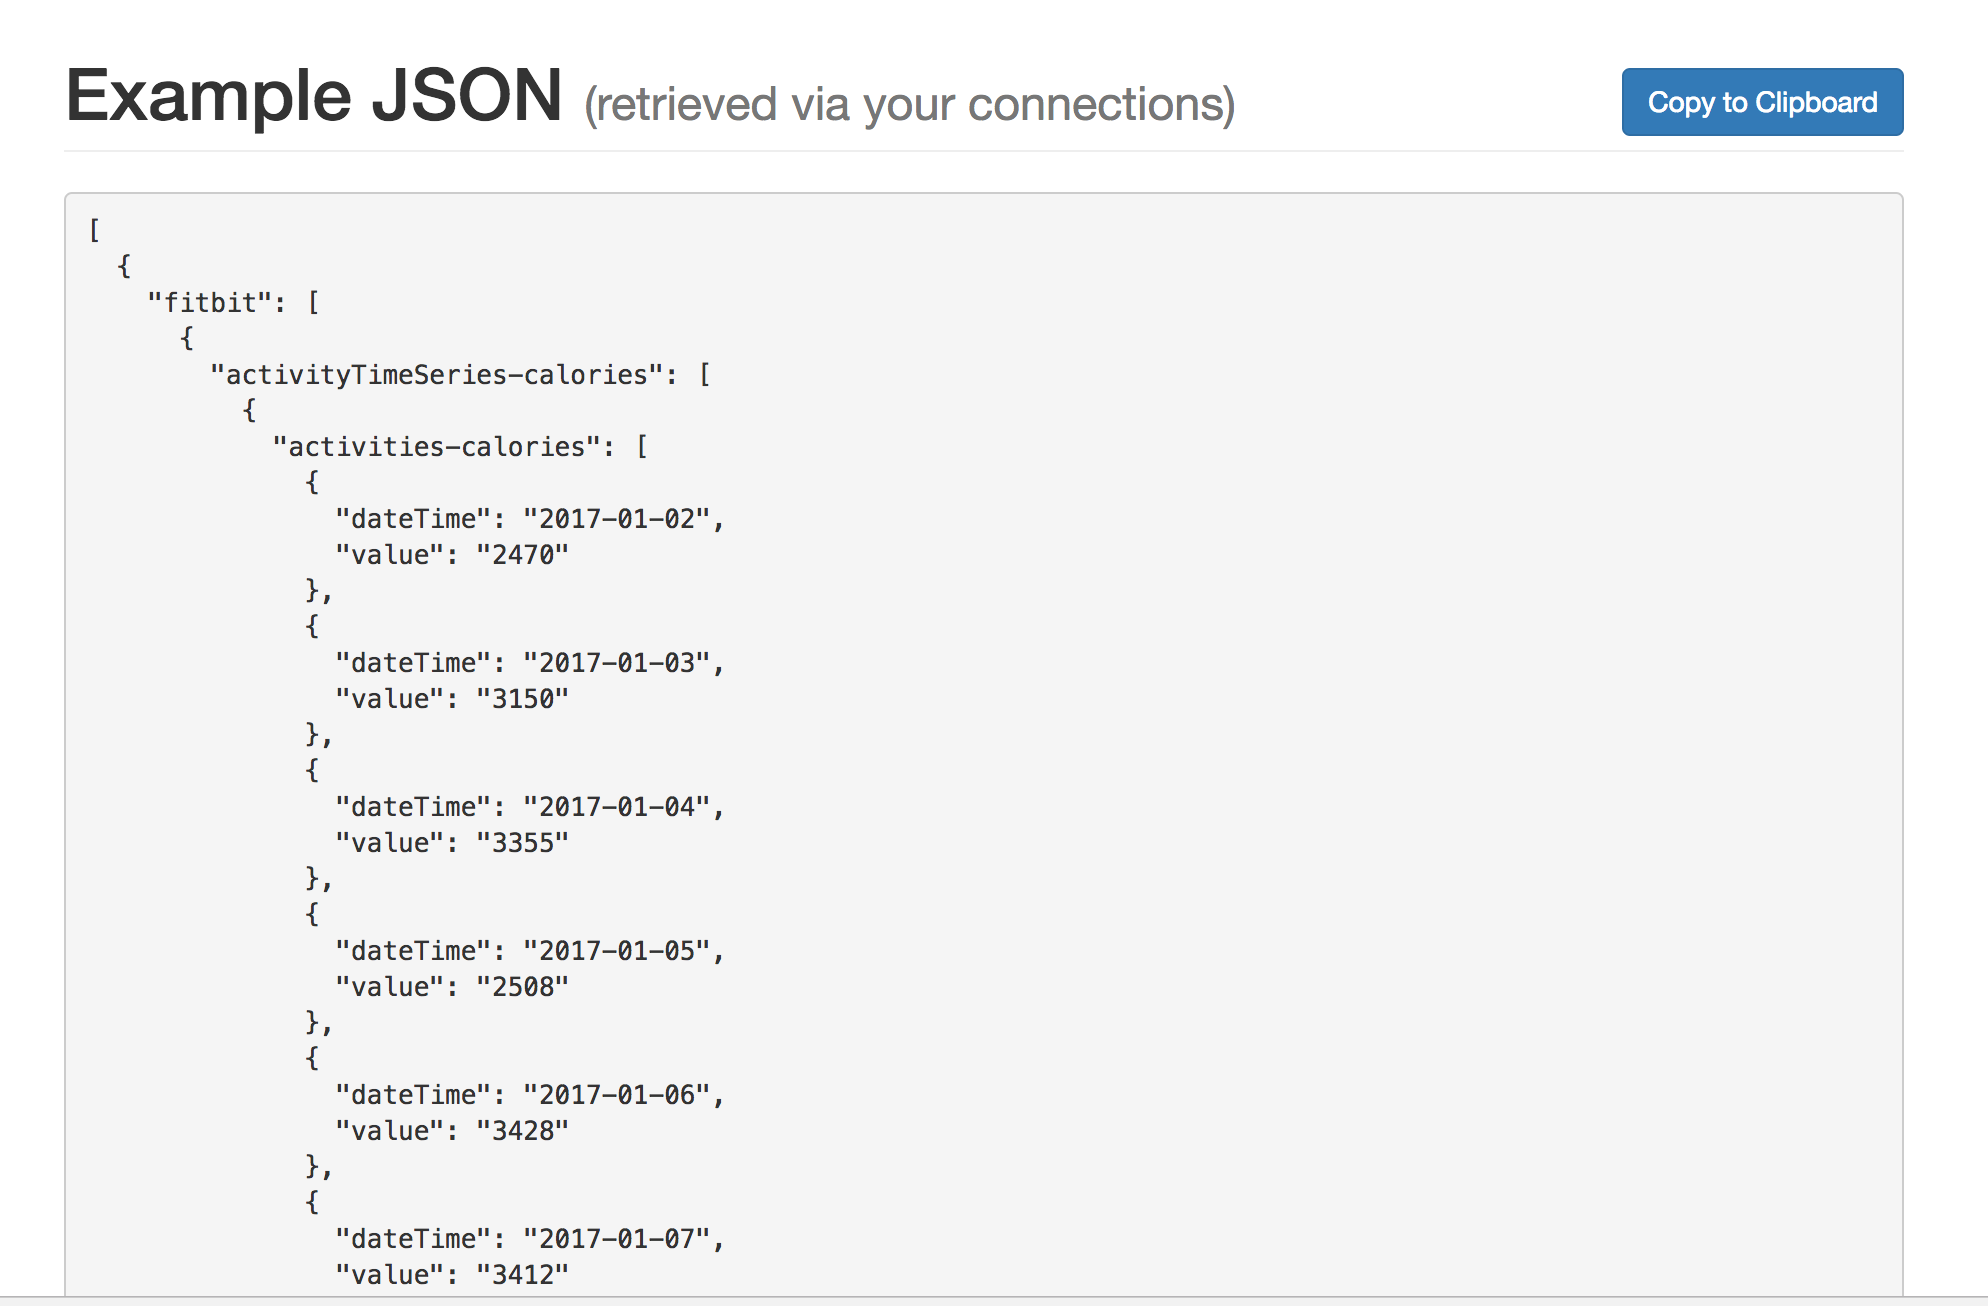
By clicking View JSON, you will be given example data (using your own connections) that shows how the data will be formatted before it is fed into your source code. Copy this data to your local environment to develop your app/analysis.
An app/analysis works like this:
Data is accepted by your program, your program does some computation on the data, then your program outputs regular HTML/CSS/Javascript. This output is then injected into the web app for viewing.
For development of an app/analysis, you are provided with a small test directory that includes two files: app.py and data.json. Copy and paste the Example JSON that you created before into data.json, edit the app.py Python program to perform the computation you wish (re-formatting to HTML/CSS/Javascript within the program), and run a simple command in your terminal to run the app for you to view locally in your browser.
A few notes:
At this time:
- Only Python applications can be run.
- Unfortunately there is no support for SciPy but that will change.
- Apps can only require data from Moves and Fitbit BUT, if there is an API you would like to access I can add it for you as quickly as possible!
- Apps cannot take in user input, they can only do calculations on existing data and print the output
- Graphs such as the one seen above were developed using matplotlib and converted to D3.js using the mpld3 library. There are other python tools like this for creating nice graphs that could potentially work
- While the login and authentication for the webapp is secure to an extent using measures such as password encryption and Oauth2 authentication for connections and access token retrieval over https, there is some risk of privacy since this is just a prototype.
I hope this has sparked your interest. I’d value any feedback you have on the forums or directly to me, and I can send you a link to the app if you’d like to help!