Triggers of Arrhythmia

INTRODUCTION (Added December 28, 2020)
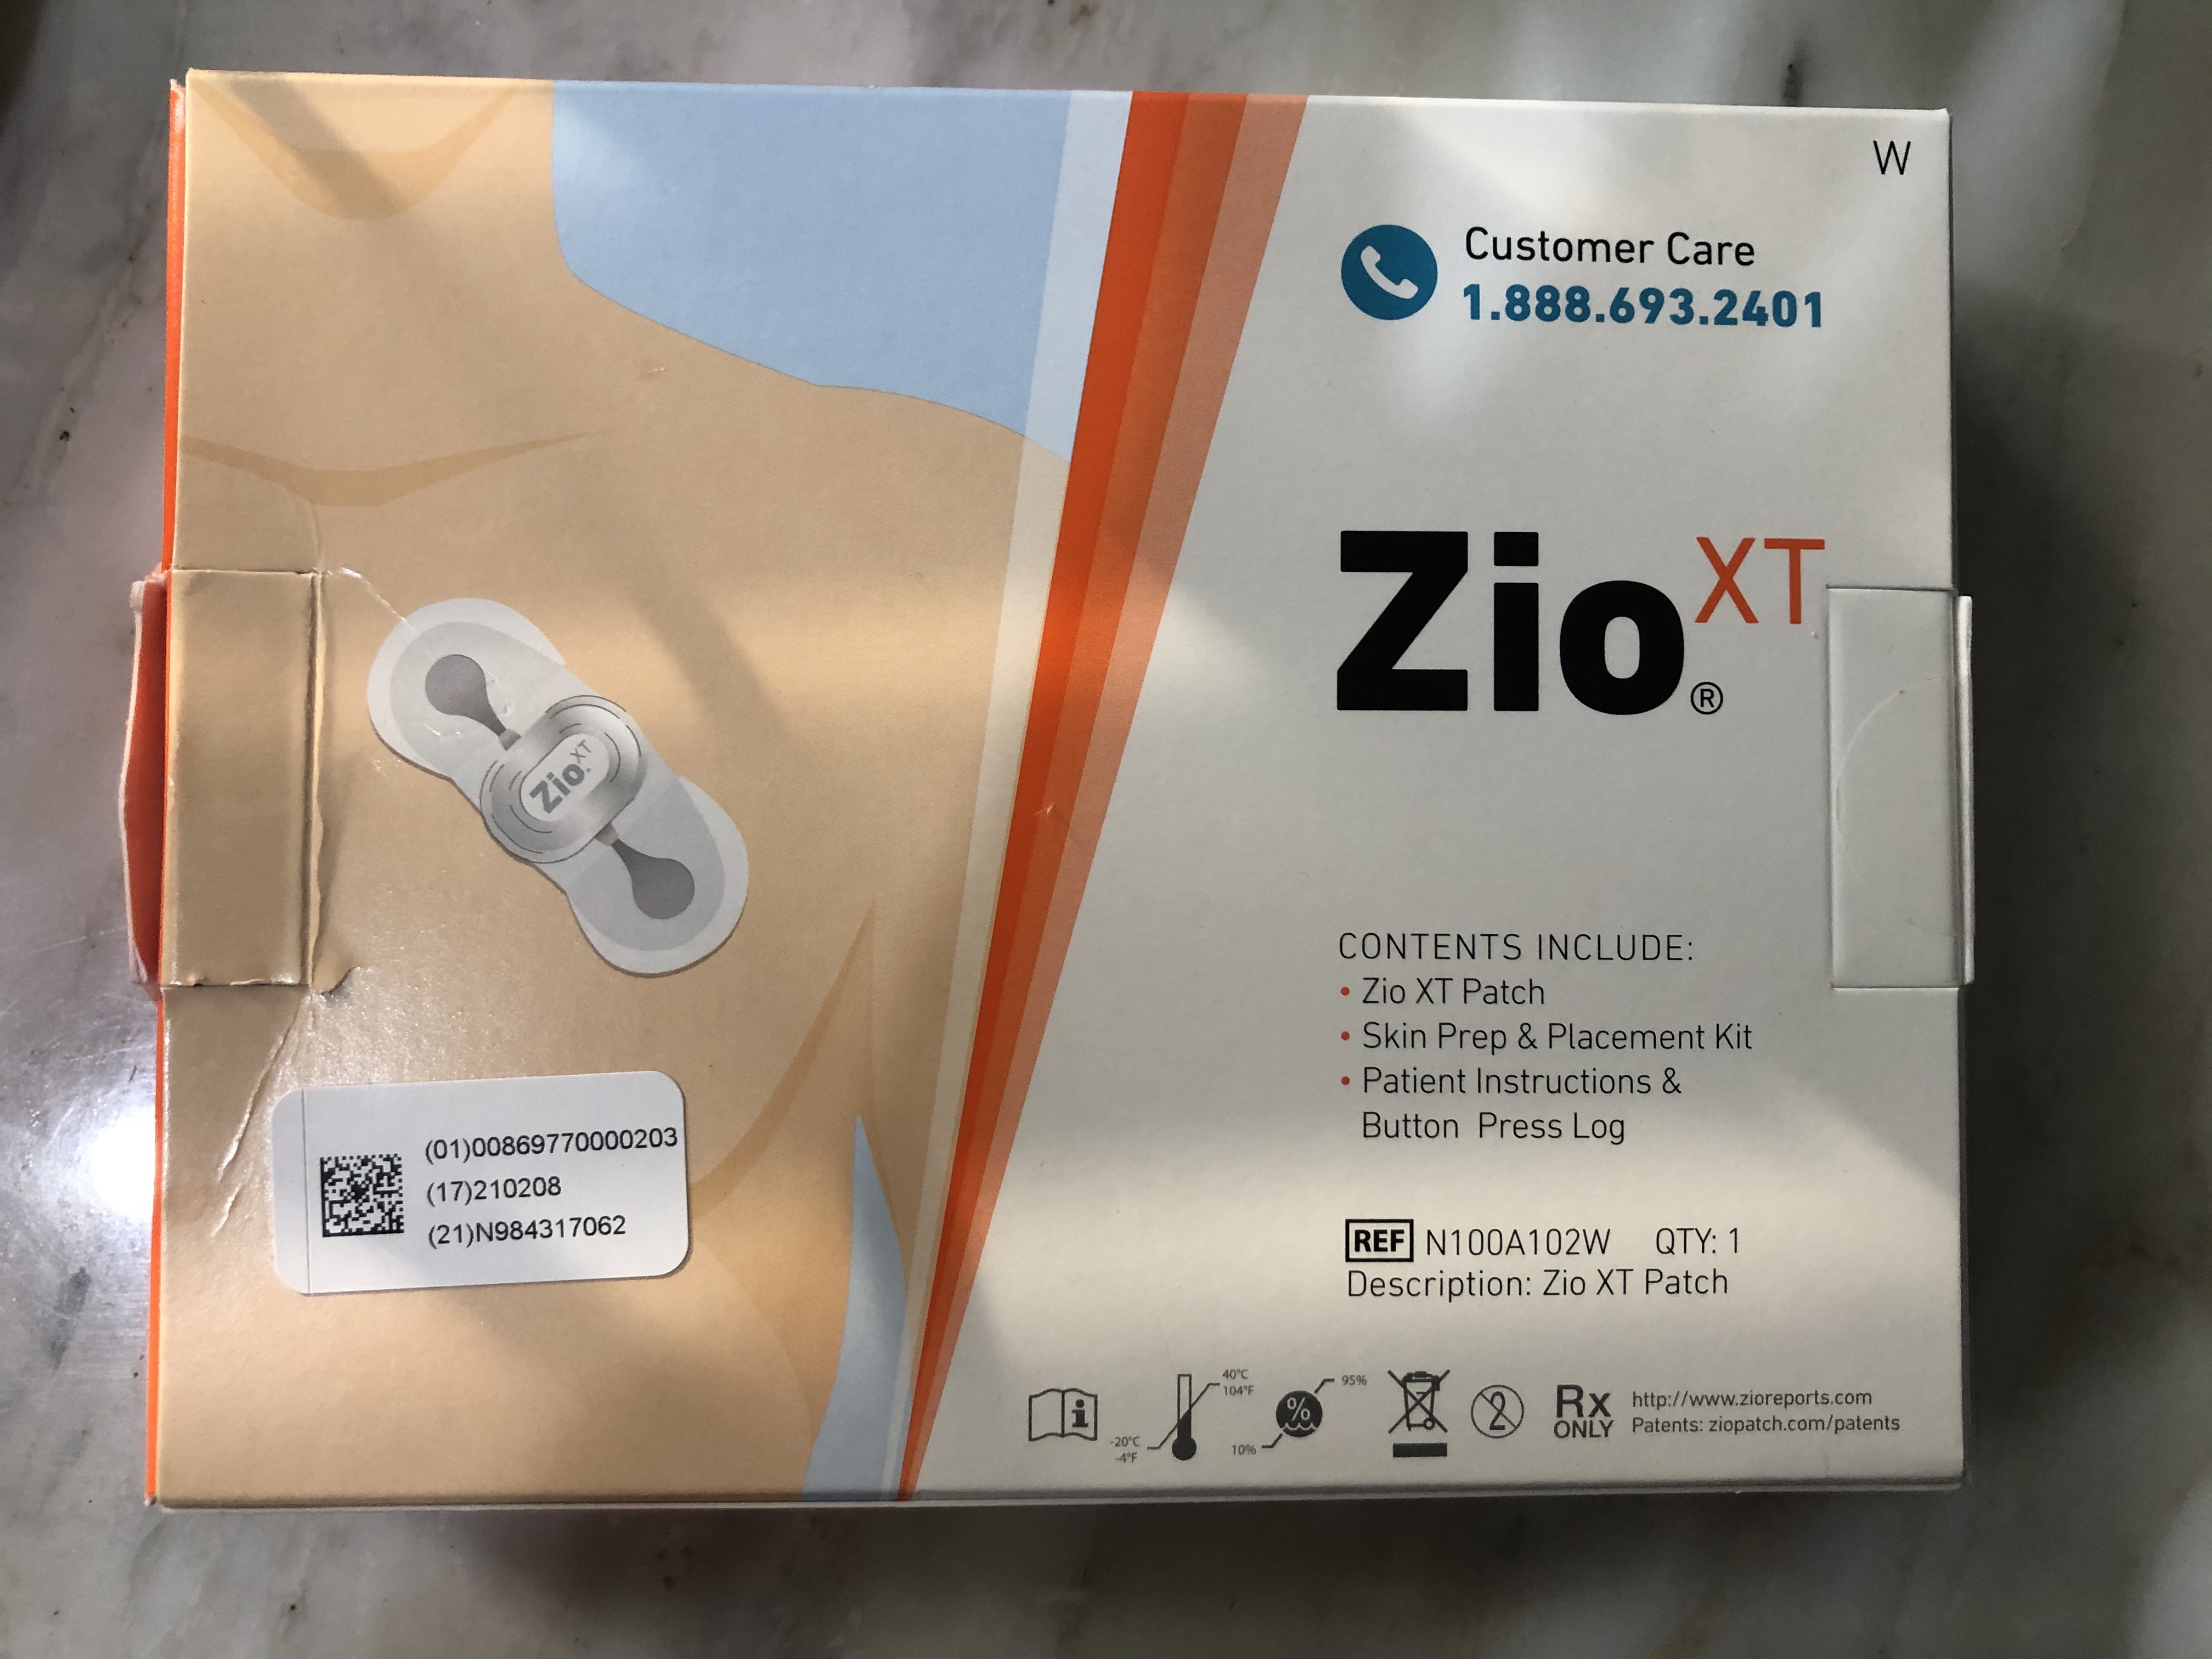
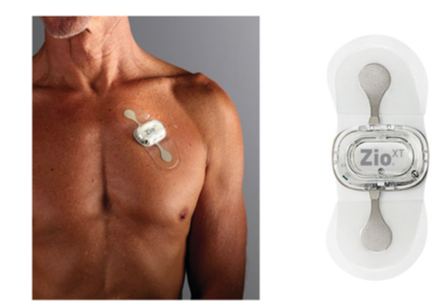
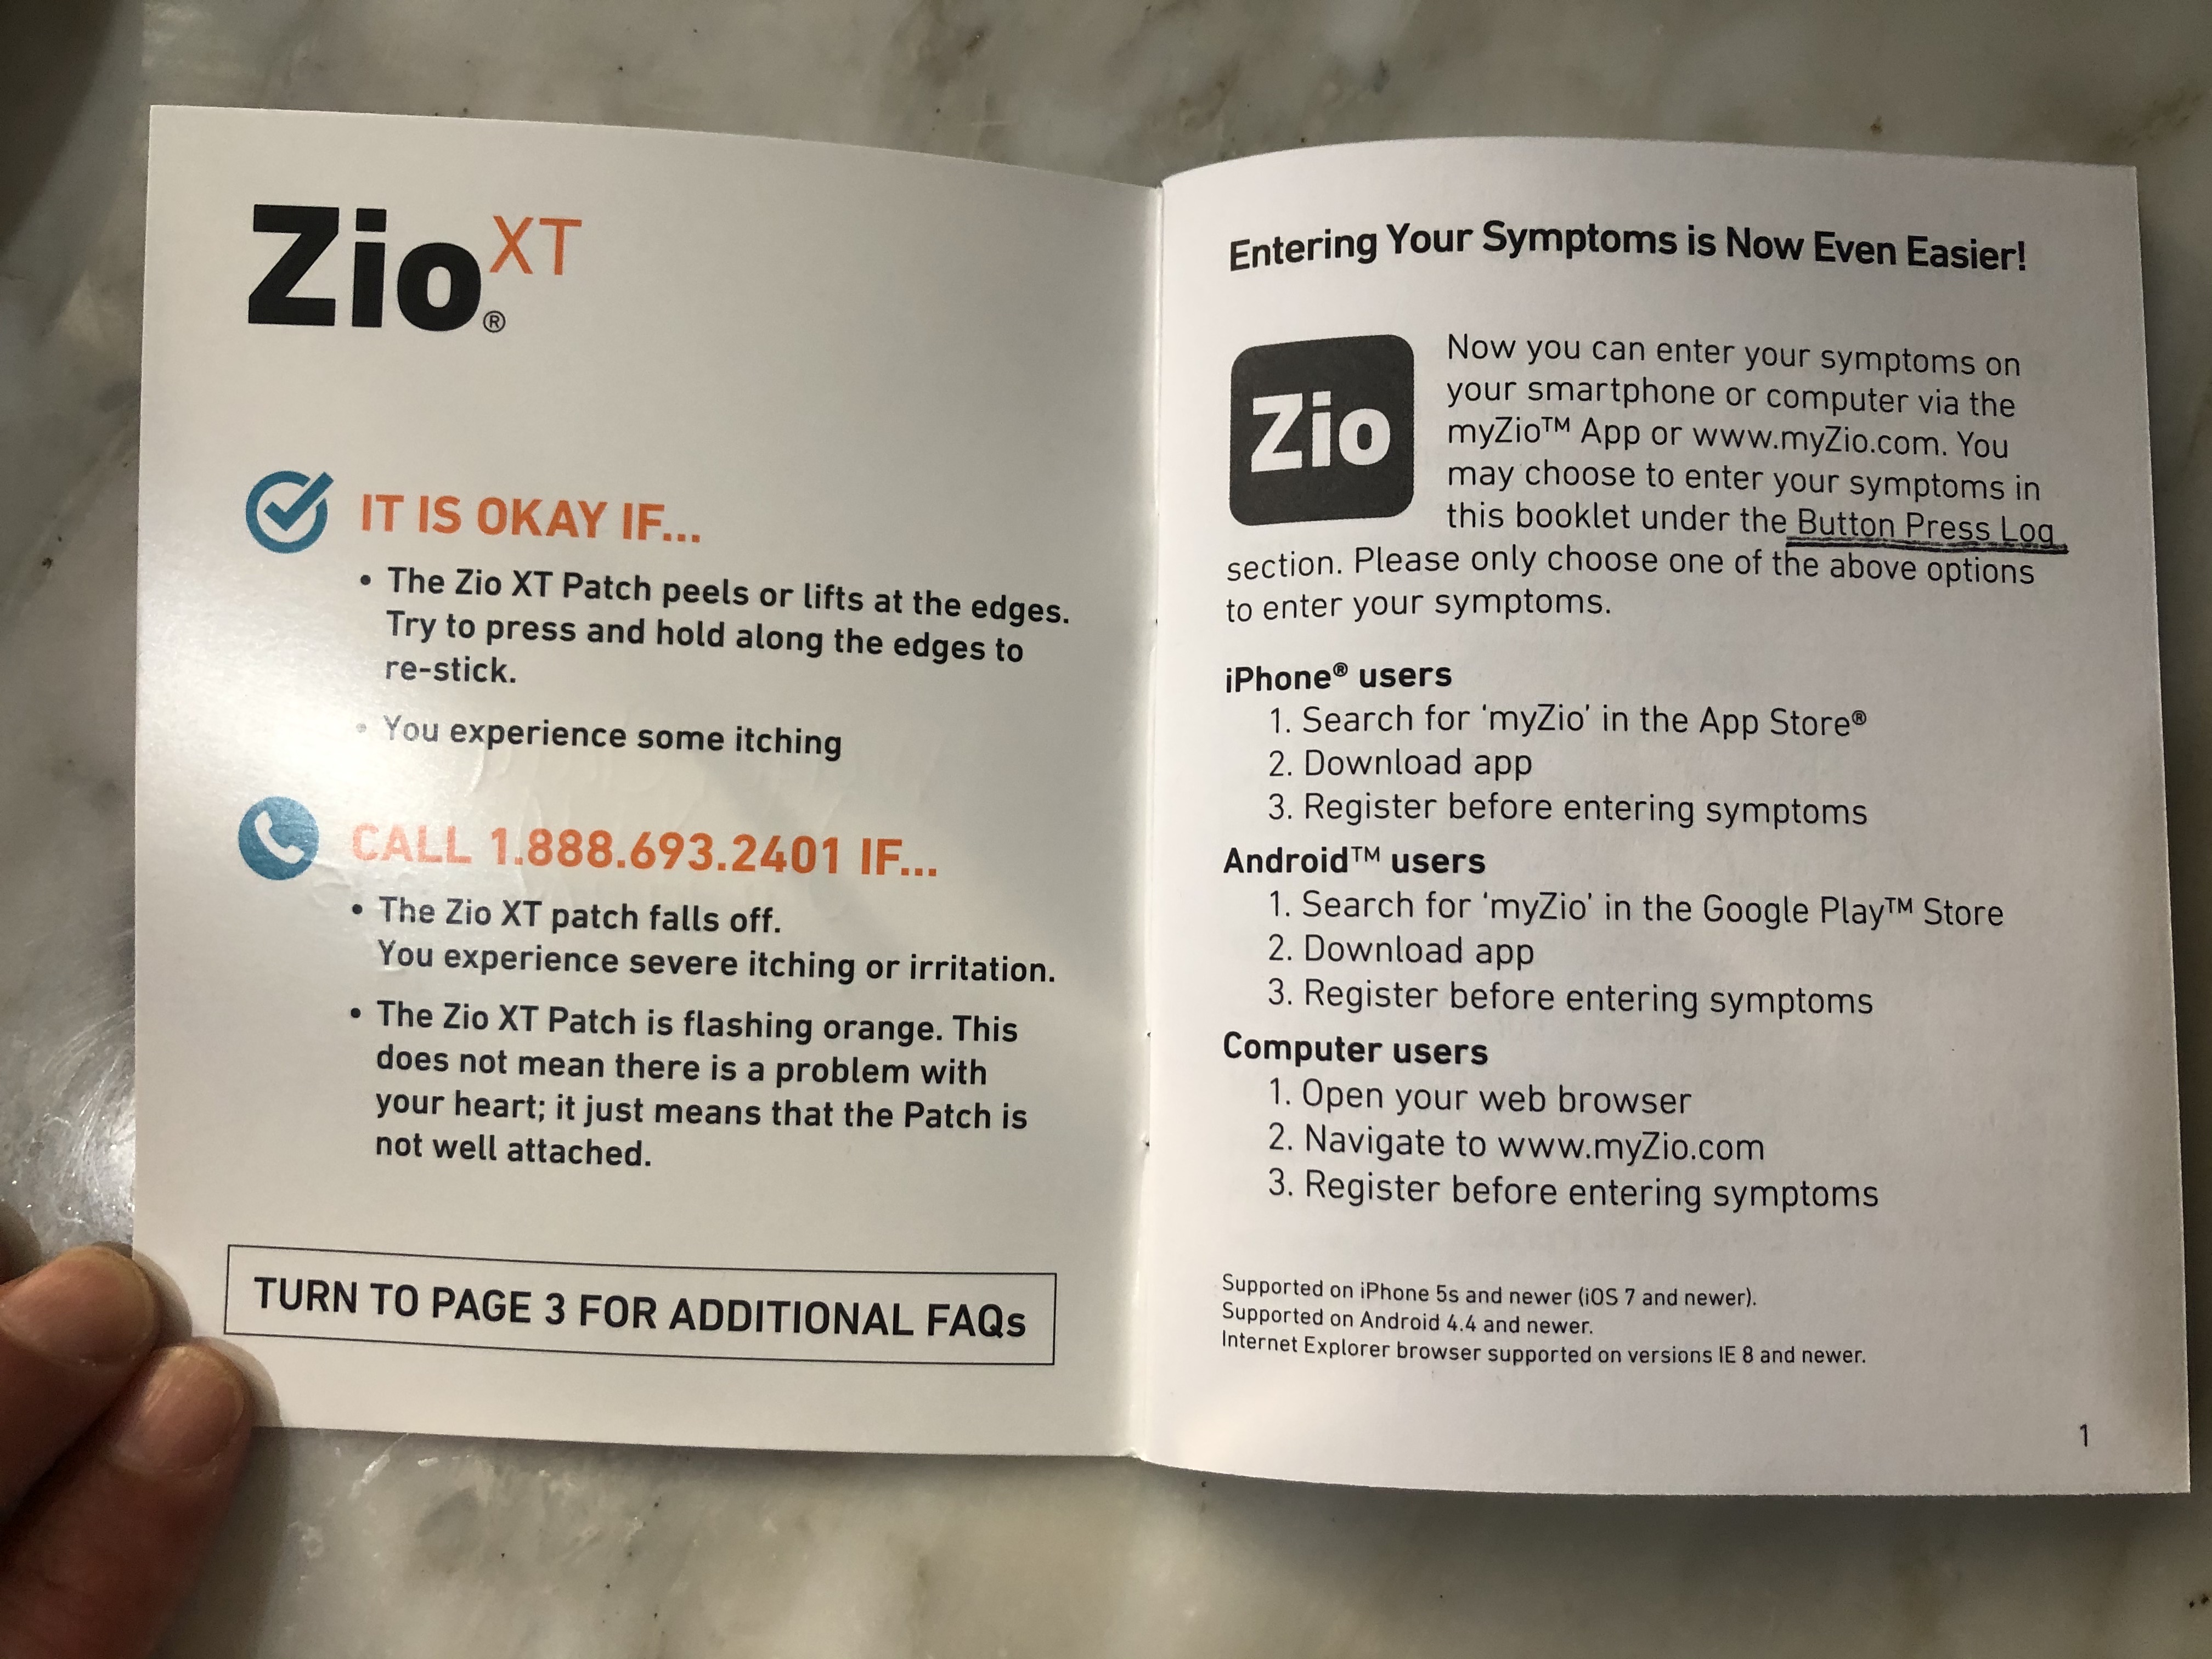
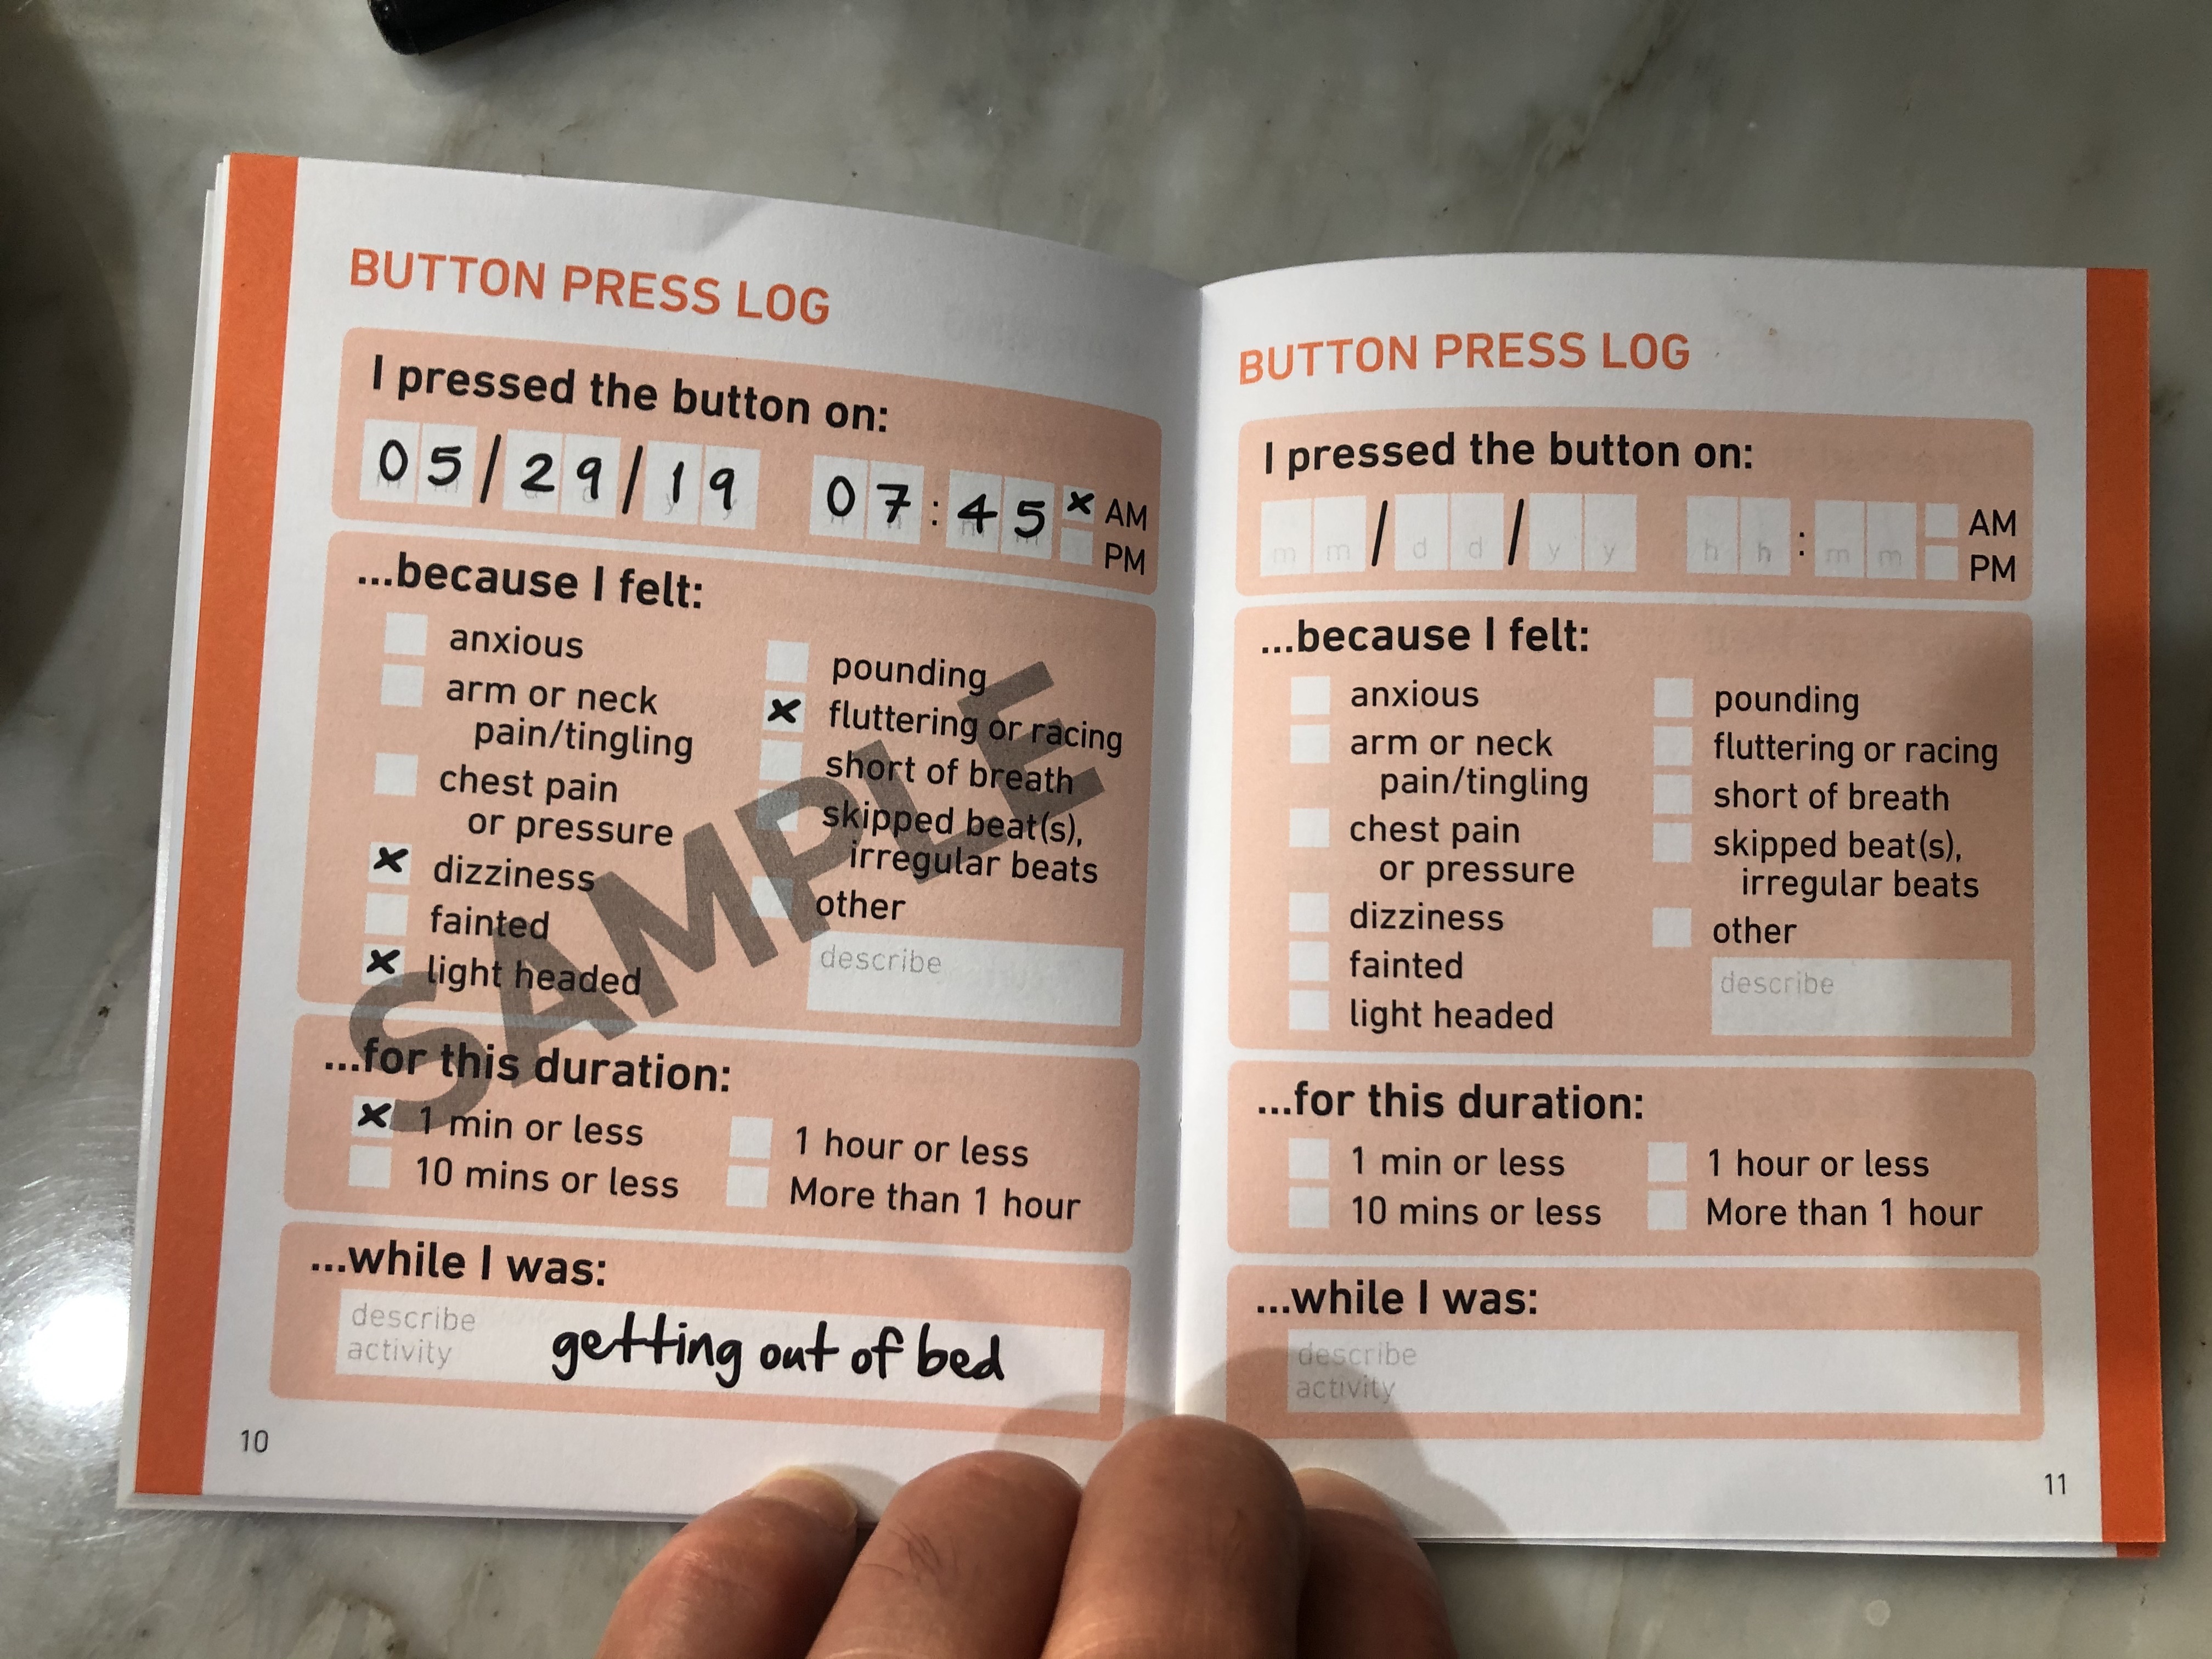
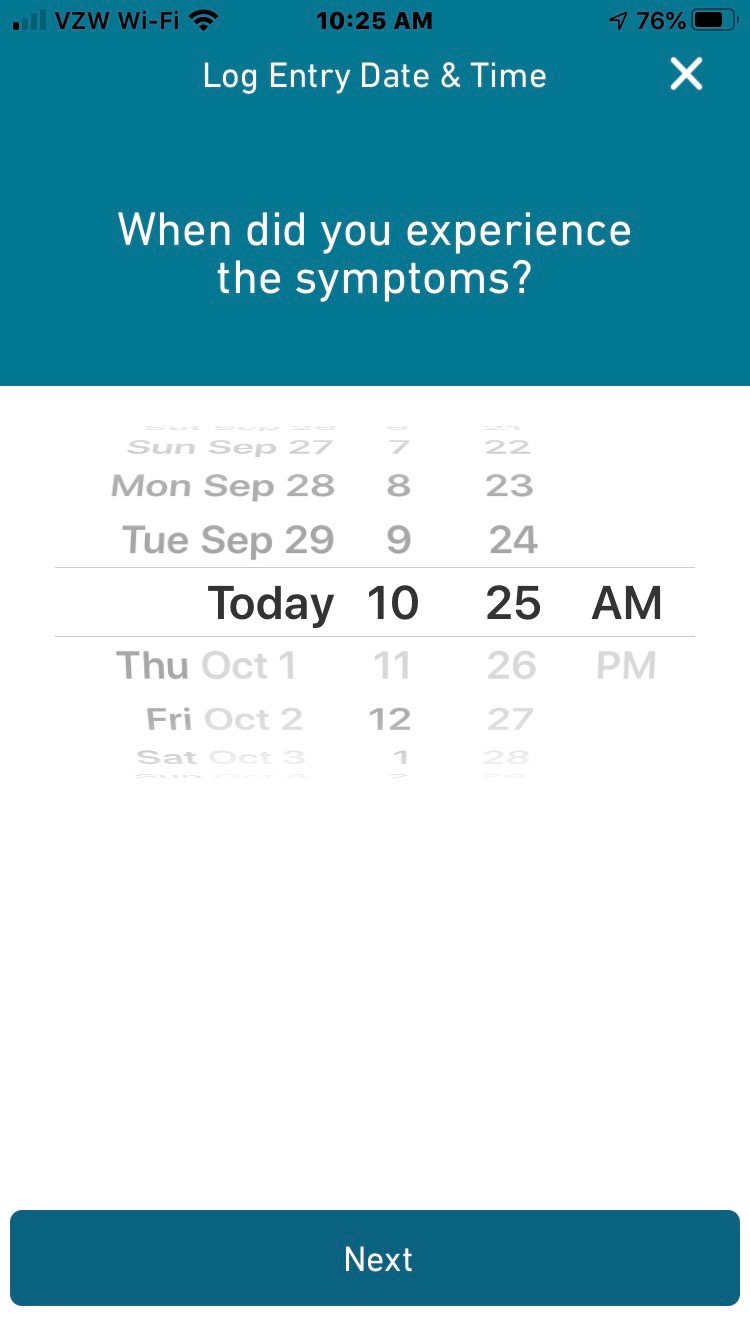
This is a project log about tracking my arrhythmias. The notes begin with some journaling reports and quickly move into tracking arrhythmia events using the 1-Button Tracker. In September I begin tracking with a biomedical device (the Zio patch) and run a correlation test between the Zio and the 1-Button method. In November I began taking metoprolol, a beta blocker, and tracking doses while also continuing to track events with the 1-Button. As of today I haven’t yet run an analysis of the medication vs events, though it is obvious the medication is helping.


Original 1st post continues below:

I just created an account on EventLoggers, a journaling and data integration tool created by @dreeds, who is active on this forum. It seemed like it could be useful to me in a project I’m doing to investigate the triggers of my arrhythmias. Through some self-tracking and sharing my data in a video conference with a cardiologist, I’ve learned that these are most probably all premature ventricular contractions (PVCs). It’s a common condition, and many people find they are triggered by alcohol, coffee, stress, sleep problems. I’m not sure enough about what’s going on to do a very rigorous experiment. My tolerance for controlling my daily life through very careful timing of events and lifestyle changes is not very high, so before I try to do something difficult I want to know more about what’s going on. So I’m going to keep a journal on EventLoggers for two weeks and then assess.

I normally drink about 5 drinks a week, rarely more than 1 to 1.5 ounces of 80 proof liquor per drink. I’ve been leaning against this and haven’t had a drink since Sunday night, and also haven’t had a severe arrhythmia period since Tuesday. So – a more or less natural experiment is already under way. Eventually I’ll have another drink, certainly by this Sunday when some in-laws come over for a (well distanced) visit outside on our lawn. I’ve also limited myself to a single cup of coffee in the morning.

What is responsible for my improvement? Less coffee or no alcohol? Or both? Or something else all together? Over time, I hope to find out more.

1 Like

This would bother me enough to go the “elimination diet” route, i.e. cut out everything that’s known to cause issues, and then if that helps, start adding things back… Otherwise, in the absence of a single, strong factor, you could end up collecting data for a year and still be inconclusive!

Yes, I may get there. But right now the candidates are: stress, poor sleep, carbs in diet/blood sugar, alcohol, coffee, vigorous exercise (as a trigger). I suspect that an “elimination” approach as a first step will fail due to not being able to maintain it. So my first phase is to log meals, sleep, and arrhythmia events. I’ll do this until sometime next week, and then try to see these on a timeline together. Maybe something will jump out at me to try more rigorously. So far, I’ve done the easy thing, which is to make some modest changes all at the same time: cut coffee to one cup a day, cut out alcohol mostly (<1.5 ounces of alcohol all together over the last days). Sleep is harder, but I’ve managed to sleep in several days.

Here’s April/May data. I started to change things on Monday the 18th. You can see things got a lot better with the exception of Thursday, when I had a bad episode during the afternoon. I was keeping a log then. I had an unusually heavy lunch with white rice that day, so carb/blood sugar as well as heavy eating in general stays on the list of suspects. Interestingly, before I posted this I looked at the data but not at the log. I asked myself: What happened Thursday? I couldn’t remember anything related to possible triggers that day. It was only a few days ago, but I didn’t remember what I had for lunch, and didn’t think about that as a possible culprit. Then I looked at the log, and remembered there had been a particular heavy lunch outside at the picnic table in which I efficiently confronted all the left overs from last night’s dinner with my family. It was funny to me that I had eliminated this from memory.

1 Like

Supporting the idea of meal triggers, independent of content of meal, is this breakdown of episodes by hour. The spikes in button clicks seem to roughly come right after meal times. It’s not crystal clear, possibly due the face that my lunchtime doesn’t occur at the same time every day, but it roughly corresponds.

1 Like

Noting that I had a device issue today (lost it temporarily). Reminding myself that time of day data will not be accurate for June 24 2020 and should be left out of any analysis that looks at this level of timing. I added some observations for the day, approximating the correct total, but the time stamp will be wrong.

Below is a summary of the project so far before I go on to a new phase. In the spring phase of this project my 1-Button data suggested PVC arrhythmia episodes jumped around the time of my first meal. I found that on a daily cycle, meals seemed to get arrhythmia going for the day. I also saw weekly and monthly cycles showed that stressful life events seemed to go along with worsening arrhythmias. In April I added a tracking method: The Kardia 6L (for “six lead”) device, which allowed me to record an ECG at home when I noticed a particularly bad episode.

Here is a video of the Kardia in use. I am also using an SpO2 sensor in this video, and you can easily see the arrhythmias occur in the sensor display:

In April I saw a cardiologist. Using data from from the Kardia, she confirmed the type of arrhythmia was “premature ventricular contractions,” or PVCs. What I learned from presenting my data to Dr. Yang:

  1. I got a diagnosis! I was very happy to know that PVCs are considered not very harmful.
  2. Good to learn that Dr. Yang did not need more tests before giving a preliminary diagnosis. She knew about the Kardia (but never had a patient use one before).
  3. While Dr. Yang was happy with the Kardia for PVC diagnosis, she was concerned that I might not be noticing all the PVCs with my 1-Button. treatment plan required understanding the frequency. Recommended treatment depends on how frequently this is occurring: Under 1%, none. 1-2%, can consider medications. >2% can consider surgery (ablation)

In August the episodes declined quite a bit, and I felt less urgency about the question of triggers. If the type of arrhythmia is generally not dangerous, and I’m having many days with no episodes and my worst days the episodes are infrequent, then I’m going to watch and wait. Here is my data through early September.

In the middle of this month, I put my 1-Button tracker through the wash! And, through the dryer! It was lost for many days and I was sad. When I found it in the breast pocket of a laundered shirt I didn’t even want to connect it and accept my loss. But eventually I did, and it still worked. This inspired me to move on to the next phase of the project, which is attempting to evaluate the frequency of the PVCs using both the biomedical approach and the personal science approach, and to see how sell these align. Today, I was fitted with a very simple biomedical device called a Zio patch, which adheres to the skin of my chest and records data for 14 days. I have also restarted my one button tracking. I’ll post some updates as I go.

2 Likes

I’m doing some reading about the Zio patch. In one of the studies, the researchers report that:

“Over half our patients (53.4%) did not have an arrhythmia despite a triggered event. This allows the clinician to potentially exclude an arrhythmia as an etiology of the patient’s symptoms and potentially avoid further cardiac evaluation.” (Ambulatory Cardiac Monitoring for Discharged Emergency Department Patients with Possible Cardiac Arrhythmias)

A “triggered event” is a self-recorded symptom report that involves, at minimum, pressing a button on the top of the Zio device. (In the current system, it may also include a written note in an app or notebook.) I’m not totally clear on whether my particular type of arrhythmia, as diagnosed by my cardiologist from the Kardia ECG data, would have been counted as an arrhythmia during this earlier study. The list of arrhythmia types is below:

  • Ventricular tachycardia (≥4 but <8 beats):
  • Ventricular tachycardia (≥8 beats):
  • Pause (>3 seconds):
  • AV block (2nd degree Mobitz II or 3rd degree): Supraventricular tachycardia (≥4 but <8 beats): Supraventricular tachycardia (≥8 beats):
  • All atrial fibrillation:
  • Chronic atrial fibrillation:
  • Paroxysmal atrial fibrillation: Torsades/Ventricular fibrillation

These are all serious arrhythmia events, and as far as I can tell premature ventricular contractions with pause of under 3 seconds is not included. Looking roughly at my own data, I do not think that the pause between my heartbeats when I experience PVCs is greater than 3 seconds. My typical heart rate is between 60-70 bpm, and my typical PVC symptoms involve a delayed beat, then a feeling of flutter, then a regular beat. When this happens many times in a row, I feel pretty bad and my Sp02 drops. But I haven’t noticed pauses of over 3 seconds, which for me would be very long. In the study listed, the patients with serious arrhythmias are experiencing stronger symptoms than I am.

A couple questions:

  1. If anybody recognizes an error in how I’m thinking about this, will you let me know? Maybe my take on the reported arrhythmias from the earlier Zio studies is incorrect.
  2. If my take is correct, then I wonder if the data reported from my current period wearing the patch will show my particular kind of PVCs. The Kardia device did not identify these PVCs as a specific event, but rather reported ambiguous non-normal results that required the cardiologist to interpret. I suspect that Zio analytics have improved in many ways in the years since this study, and can now give a quantitative assessment of PVCs of my type. Glad to hear anything about this, though I will also know once the data is visible.

I haven’t recorded any arrhythmias yet today on my 1-Button tracker.

This confirms one of my interesting finds with CGM. I wear a Garmin with continuous HRM and often enough, consumption of excess sugar would set off the Garmin HR alarm before the CGM rising alarm.

1 Like

Some details on the Zio Patch.

The patch comes in a 6"x8" box:

The device is placed on the chest by a medical assistant, who shaves an area if hair is present, abrades the skin with a light sandpaper-type material, and applies the device using tape with adherent:

zio placement
(Although this is a Zio marketing photo, it is also totally how my chest looks.)

You cannot swim or submerse the device, though you can shower if you avoid spraying the device directly with water.

You are given a choice of app based or notebook based recording of events:

I will doubtless use the app:

1 Like

Fifth day of monitoring with both Zio XT patch and the 1-Button monitor. One bad arrhythmia period so far in the 5 days, and some incidents every day. I have been careful about collecting all the 1-Button observations. This is pretty routinized as I’ve been doing it for many months, so I have confidence in the data. I’ve tried to be very careful with the Zio app observations as well, but something strange happened with the app yesterday. I went to log an observation and had to enter my login credentials again. This is the first time that had happened since I originally logged in. Then, my stored password didn’t work. I had to create a new password.

Possibly an app update?

When I checked, there was a log of my observations going back to the first day, but some of my observations from the day before were clearly missing. These observations were made when I was hiking in Marin County, with no Internet access. I think these observations were stored for later upload, but never uploaded, and whatever happened that caused the app to reset my password caused the data transfer to permanently(?) fail and the data to be lost.

I’ll keep my eye out for the missing data, but since neither the app issue or update was logged in a way that I could see it, and no error message was generated, I’m left with doubts about the completeness of the data set. Frustrating!

1 Like

I’ve now abandoned entering notes into the Zio app. The app was not functional for this purpose because:

  1. Obscure connectivity or app update issues resulted in lost observations. Lack of error notification means I can’t account for these issues very easily when I look back on the record.
  2. The mode of making the observation is inconvenient and requires mental decision making that I think is inconsistent. The app asks for a choice about whether the symptom duration is “<1 minute, <1 hour, >1 hour.” When I feel a symptom, I pull the phone out and record it, marking <1 min. A few minutes later, at the next skipped beats, I pull the phone out again and record another symptom, also marking <1min. But maybe I should have waited and marked <1 hour? That would have been more convenient, but I didn’t know the symptoms would recur so quickly. After doing this for a few days, sometimes waiting and sometimes not waiting,I developed a lack of trust in my record.
  3. Last night I had an outside visit with family friends, and didn’t want to pull my phone out of my pocket to record felt arrhythmias, which lasted through the course of the dinner. I was able to click the 1-Button discretely, so my 1-Button observation protocol is still going, but I made a decision in the moment not to keep going with the app.

So, the upshot is that I continue to wear the device, and continue to record felt symptoms on my 1-Button tracker. I will be interested to see if I can connect these in the analysis phase.

Jinxed it. No sooner had I made this last post than I made an error on my 1-Button protocol. I left the button on a table while getting dressed, then got into a series of online calls that made it difficult to run upstairs and retrieve it. I started to have PVCs during the calls and they weren’t recorded. When I got my device back in hand, I recorded 6 presses for the approx. # of times I would have pressed during the 2.5 hours of calls, doing my best to retrospectively estimate. Now I’m noting the problem here so I can deal with it during analysis, either by skipping today or by adjusting the time.

I’ve been using Roam Research as a note taking tool, so I’m also creating a data correction tag so that I can easily query for these. This is more for the sake of experimenting with Roam than for this project, since I hope not to have so many corrections that I have to query for them. But just in case…

I found a super interesting paper from 2019 that answers one important question and suggests several others. My cardiologist has offered me treatment options based on % of time in arrhythmia, but I haven’t been certain about what this means. My guess was: # of missed heartbeats divided by # of total heartbeats in the sample. Without recording every heartbeat over a longish period of time, this ratio is very hard to determine, since my PVCs are intermittent and my heart rate varies.

This study hoped to contribute to understanding the relationship between PVCs and cardiomyopathy by looking specifically at the effect of PVCs on the cardiac parasympathetic nervous system. To do this, the researchers induced PVCs in pigs. I can see from their description that PVC burden is defined just as I guessed: # missed beats/ # total beats. (It’s unclear to me if the skipped beat is counted in the denominator, but for my general understanding that’s not important.)

Currently, there are no clear cut-off points that delineate the PVC burden at which cardiomyopathy may develop (4, 6, 17). However, several studies have suggested that a frequency 10%, and especially 24%, is associated with development of cardiomyopathy (4, 17, 37). In line with these studies, we chose to deliver PVCs at an average burden of every 5 beats (~20%) Premature ventricular contractions activate vagal afferents and alter autonomic tone: implications for premature ventricular contraction-induced cardiomyopathy, Salavatian et al., American Journal of Physiology-Heart and Circulatory Physiology, 317(3) 2019

That was good to know.

However, the article was much less sanguine about the consequences of PVCs than my cardiologist. PVCs are associated with higher risk of heart failure, and one of the studies cited in the paper, a 2019 analysis of California health data concluded that:

"a diagnosis of VPCs independently predicts incident systolic HF. This effect is most pronounced in younger patients without co-morbidities, suggesting that VPCs may be an important cause of “idiopathic” HF. (Relation Between Ventricular Premature Complexes and Incident Heart Failure, Agarwal, Vratika et al. American Journal of Cardiology, Volume 119, Issue 8, 1238 - 1242.)
Note: as far as I can tell, VPCs and PVCs are synonyms.

The paper is behind a paywall, but it’s interesting to note that this condition, which is extremely bothersome and sometimes causes my SpO2 to drop to 94 as measured on my cheap blood oxygenation meter (during which time I feel light headed) is not conclusively harmless. Adds to my motivation to learn, at least.

Back to the pig study. The researchers found evidence that autonomic nervous system imbalances can be caused by PVCs and speculate that these can contribute to development of cardiomyopathy. Specifically:

PVCs activate mechanosensory as well as chemosensory neurons in the inferior vagal ganglia, and nodose ganglion sensory neurons are capable of statedependent adaptations and display memory in response to cardiac stimuli. Because of this capacity, any excitation of this population of cardiac afferent neurons persists following the initial insult, further exacerbating the pathology of cardiac arrhythmias and cardiomyopathy.

Yikes. Let’s see if I can reduce these PVCs.

This memory effect, if it is real, doubtless combines with role of the autonomic nervous system in inducing PVCs, since stress and exercise are common triggers. I’ve seen that my own PVCs come in waves that can last many days in a row. If the likelihood of my having PVCs on a given day is increased by my having had them the day before, then it makes sense to try to find a way to dampen the cycle, even making changes that I know I can’t sustain over time, in order to see if they can stop the PVCs for long enough to establish a temporary equilibrium at a lower level of arrhythmia.

2 Likes

I had an accidental button press this morning at between 11:30 and 11:45 am. This has never happened before; noting it to remove this observation at the analysis stage.

Also, this morning I started a timer after my first meal. I want to be able to note the time between my first meal and my first button press. However, I’m currently at 2:25 and haven’t yet had an episode. Interesting. Today I didn’t eat bread with breakfast, not intentionally but happened to have a corn tortilla instead. Noting this because I’m thinking about what potential triggers to track during the next phase, and I may want to separately note bread rather than include it in a “food” or “carbs” category.

A tutorial on Case Crossover design: http://www.pitt.edu/~super1/lecture/lec0821/001.htm.

There are definitely some issues here that need to be addressed if I’m going to design an approach that will yield inside into triggers of PVCs. During my five months of observation I’ve noticed I seem to get more PVCs:

  • after eating
  • after stressful events
  • after eating bread
  • after exercise.
  • when I’m short of sleep.

But “after eating” includes “after eating bread” and I’d like to be able to distinguish these. Also, being short of sleep is a 1/day exposure, which means I can only compare at daily resolution; the others are 30-60 minute exposures, and I can compare periods of exposure to the supposed triggers to other periods in the same day.

Thinking a bit about why kind of design could work. Other triggers I’d like to include: amount of coffee, timing of coffee, meditation that day (y/n).

Here is a technical paper about case crossover design implementation in R:
Case-crossover design and its implementation in R by Zhongheng Zhang. There is some useful description here, but the conditions of this study are different, with many subjects facing a heart attack risk (defined as an “event”), but the seriousness of the event means that most subjects will experience at most one event. So this doesn’t help me much. Also, I want a much simpler method!

Severe arrhythmia yesterday: Saturday, October 10.
When I get the data back from the Zio I want to look closely at this day. I made many observations with the 1-Button, but since the arrhythmias continued for many hours it will be interesting to see how the records compare.

I talked over the next phase of the project with a friend who does academic research on building engineering (specifically ventilation and heating/cooling). He uses a variety of methods, including wearables, environmental sensors, and self-report from volunteer research subjects. He had many useful ideas, and also some curiosity about whether I could actually consider the Zio “ground truth” for calibrating my 1-Button observations. In studying thermal comfort in buildings, he’s found it important to treat the subjects self-observations as ground truth, since the chief concern is their own experience. If you use room temp or body temp, you risk making people uncomfortable, because the same temperatures can be experienced very differently under different circumstances. He pointed out that my chief concern was my own experience of arrhythmia, which the 1-Button is already recording. What do I hope to get from the Zio data?

One potential benefit of showing that my 1-Button data is coherent with the Zio data is to switch the focus of my consultation with my cardiologist to the 1-Button data. If I’m going to try any drugs, I’d like to judge their effects with data that is more easy to collect. But this is not a very realistic goal, because the cardiologist is likely to just use the Zio data as a guide to treatment based on existing biomedical best practices; it’s unlikely she will become a consultant on exploring treatment options. If I’d like to show that my 1-Button data is “legitimate” through comparison with the Zio, that’s probably more for my own ego than for any practical purpose. Not that this is a bad reason, but good to be clear about it so I don’t go further down the path of biomedical justification than is necessary for my project.

Another benefit of looking at the Zio data is to draw my attention to episodes I may be missing. For instance, I think I have many fewer episodes before 10 am than after 10 am. What if the Zio shows that I’m skipping more beats in the morning than I realize? In that case, I should think about what the difference is between PVCs that bother me, and PVCs that I don’t notice as much. Should I treat the less bothersome and unnoticed PVCs as irrelevant? I won’t spend a lot of time thinking about this until I see whether there are a lot of unnoticed PVCs recorded by the Zio, but if there are it’s an important question.

Also noteworthy today: I changed my meditation routine, lengthening it to 20 minutes this morning and giving myself an intention to be consistent for a few weeks at least. These episodes are very unpleasant and this is a not very burdensome intervention that can’t hurt and may help.

Removed the Zio last night, one day early. If it worked, I’ll have 13 days of data, which should be enough for my purposes. The Zio became more annoying over time. The adhesive bothered my skin, the device was visible through my shirt, prompting questions I didn’t feel like answering, and I had to shower and sleep carefully. Removing it took almost half an hour using the supplied adhesive remover, it seemed like it was melded with my skin. Little bits of adhesive remain attached, despite washing with a hot washcloth several times. Overall, a rather unpleasant experience with this device, but worth it if I get the data.

Meanwhile, the last few days have been my worst arrhythmia days since starting the project early this year. This is very disappointing, because there was a time when I thought they were vanquished. I’ve been going through periods of several hours where it seems like my heart is skipping every 3-5 beats. I’m glad some of this time may be recorded on the Zio. I’m very curious about what % of beats are skipped.

I’ve learned that my observation protocol breaks down at this level of severity, because when the episode is continuous for more than a few minutes there’s no purpose served by just pressing the button arbitrarily while it continues. I satisfy myself by pressing "many’ times which a clear idea of how often this is. During a bad episode I probably press at least 10 times in 30 minutes. I’ll look at my data and evaluate this in the next few days.

I recorded a 60 second video of an episode using my SpO2 sensor. It begins with an episode in progress and my SpO2 at 93. At about 0:10 my heart returns to regular rhythm and my SpO2 rises steadily to 98. At about 0:29-21 it looks like my HR is increasing slightly and then at 0:21 there is another skipped beat. Then a series of skipped beats every 3-6 beats, with a fall in SpO2 visible. Then regular rhythm seems to return. I would say that my feeling throughout this episode was consistently bad, a woozy, carsick feeling along with fluttering in my chest.

PVCs-13-2020-Oct from Gary Wolf on Vimeo.

Another uncomfortable 24 hours with nearly constant arrhythmias, including at night. I hadn’t wanted to do much intervening during this phase of the project but I’m compelled to try some things. Trying easy things first: no 2nd cup of coffee, no alcohol, Vitamin D supplement and magnesium supplement… The supplements are an easy choice. For magnesium: negligible risk, and commonly recommended for people with arrhythmias. For Vitamin D: Our COVID-19 isolation + fires in Norther California have significantly reduced time outdoors; risk is small; there’s some evidence of link between Vitamin D and functioning of cardiac ANS. For instance:

Some background on Vitamin D:

These findings, combined with the previously reviewed effect of vitamin D in orchestrating biosynthesis of known neurotransmitters and nervous system activity, suggests that vitamin D may directly contribute to the function of the cardiac ANS, and therefore subsequent CVD-risk, by orchestrating regulatory activity at these higher brain centers of the nervous system.
Mann, Michelle Catherine, Morley D. Hollenberg, David A. Hanley, and Sofia B. Ahmed. “Vitamin D, the Autonomic Nervous System, and Cardiovascular Risk.” Physiological Reports 3, no. 4 (April 2015): e12349. https://doi.org/10.14814/phy2.12349.

Are you tracking your exposure to pollution? https://www.ncbi.nlm.nih.gov/pmc/articles/PMC3750956/

Thanks Eric, great reference. I haven’t done this. I know you’ve said this elsewhere, but what indoor monitor do you use? Along with pollutants, I’ve been wondering about CO2 buildup at night.