We’ve seen a number of talks in which self-trackers report that a sudden rise in resting heart rate predicts onset of symptoms by 24-48 hours. Can a rise in resting heart rate, which is now widely available, be useful in signaling us about infection risk? This would be a trigger to take extra measures to avoid infecting others.
2 Likes
Possibly… BUT the thing with resting heart rate (RHR) is that there are so many things that can influence it. As an example: Eat a big meal close to bedtime and you will likely see an increase in RHR if measured during your sleep. So you need to have sufficient experience and knowledge about the context around the RHR measurements in order to understand and use the measurements as an indicator. However, if you do have that I believe it can be a very interesting signal.
I’ve also found RHR (and HRV) to be a noisy signal. Moreover, when my values were elevated/reduced because I was fighting off a cold, it’s always been obvious to me already.
Makes sense. @azure has compared these noisy signals to listening to a symphony from outside the concert hall. You can make out vaguely what’s going on, but it takes a lot of work to make the signal meaningful. Eric your graph shows the difficulty very clearly.
2 Likes
it still sounds interesting, even if it’s a noisy signal.
- how much is known about “other factors” context? (are more specifics on this? maybe @azure could share more…)
- do people self-track the symptoms of being ill? (how?) then maybe track correlation? @ejain – your post mentions a sore throat, were symptoms deliberately tracked or just something you noticed in the moment?
I’m noticing I have a mild headache (unusual for me) and an elevated RHR last night. And my spouse complained of a headache last night. Coincidence?? I know it’s easy to read too much into things! But I expect we’re exposed to tons of virus via kids, and sometimes I wonder to what extent I experience subclinical viral symptoms without something distinct (like a fever).
A group from Scripps published in the January Lancet the results of a study of the RHR of 50K Fitbit users. They found a clear correlation with “Influenza-like illness” (ILI) at a population level. In a large enough dataset, when the statewide average RHR goes up from week-to-week, the incidence of flu rises as well.
Before getting too excited, remember that there is also apparently a relationship between Twitter activity and ILI at the population level. My guess is that you won’t find much value in watching your personal Twitter feed to measure your likelihood of getting the flu, and RHR is probably similar – works, kinda-sorta, at the population level, but too much signal to be useful for individuals.
1 Like
I simply noted down when there was anything out of the ordinary when I took each reading every morning. The sore throat reading had an abnormally low reading, but there had been a few other, similarly low readings that were uncorrelated with anything. Moreover, the previous day’s reading was perfectly normal, so no advance warning for me!
Maybe it would work if your daily routine was very regular, i.e. if you had the same sleeping times, same exercise, same food etc every day?
1 Like
Fair skepticism, it may be like hoping to see a personal seasonal variation in music & mood. ![]()
But this publication from Snyder’s tricked out tracking study seems to indicate personal signals. It’s beyond RHR… just found it & posted this while on my phone, so I didn’t open it to see what data looked like, which signals mattered most.
1 Like
I did a quick & dirty look into this for my own Oura HR & temperature data of ~1 1/2 years. They expose the lowest heart rate of a night’s sleep (hr_lowest) and correlated that to the temperature delta.
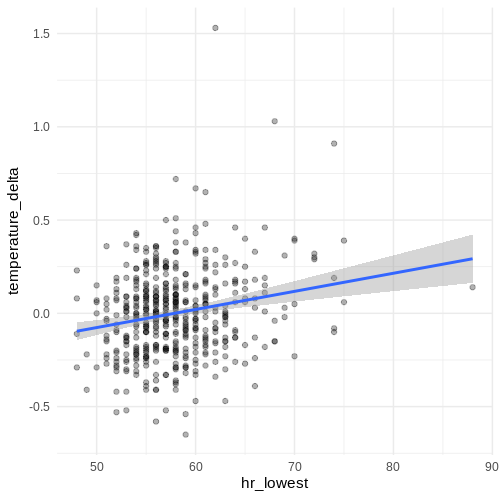
While there seems a very slight correlation it’s worth noting that some of the biggest temperature outliers (for which I know that I came down with a cold incl. fever) don’t necessarily show the most abnormally large HR values.
As others have said already, HR is influenced by tons of factors and one that’s very easy to track is the amount of sleep:
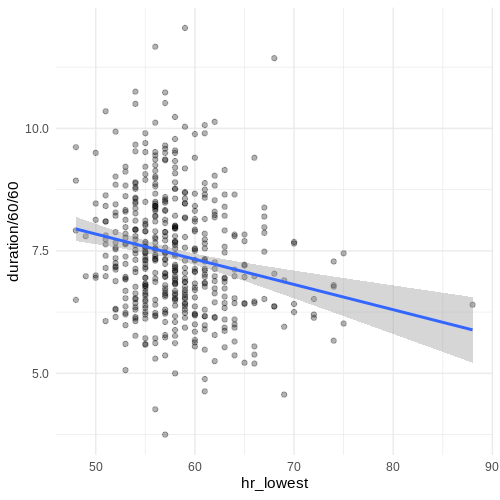
That correlation looks of about the same quality to me, with high HRs being explained by smaller amounts of sleep (no surprise there). If we now also just quickly look at a correlation of temperature values & amount of sleep we can see that the high temperature increases typically get larger amounts of sleep (who’d have guessed that I sleep more when I’m sick :D)
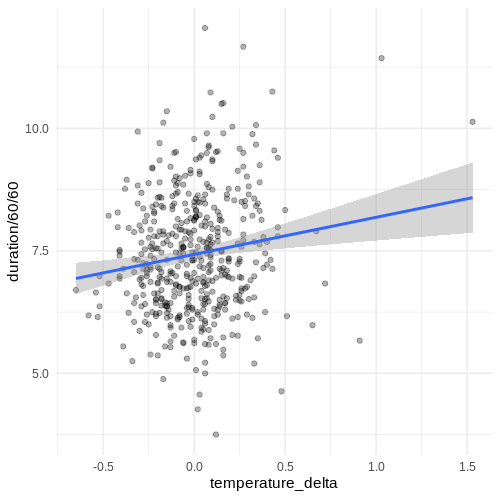
So yeah, looking at the RHR itself seems not super useful if we’re talking the individual level. In addition with further parameters like sleep etc. it might be more useful if one were to make a model, but I’ll leave that as an exercise to the reader 
3 Likes
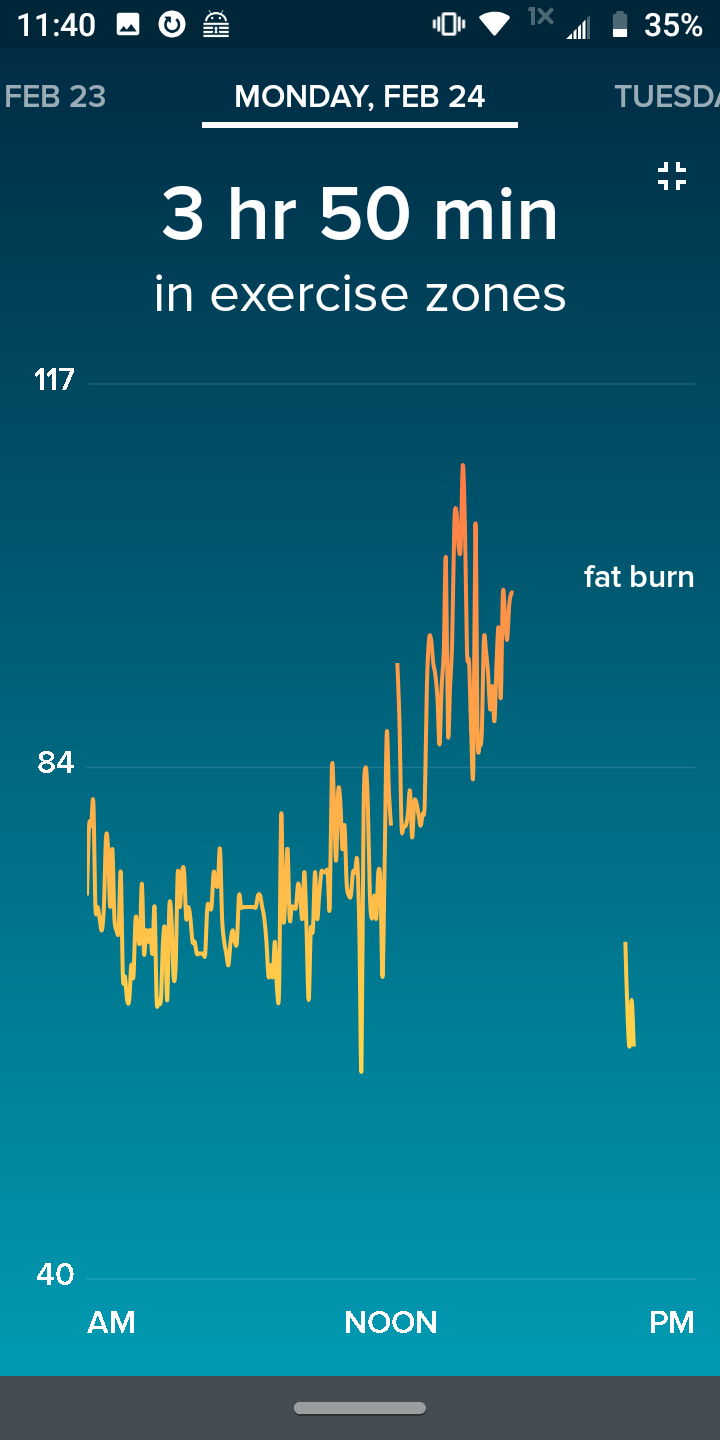
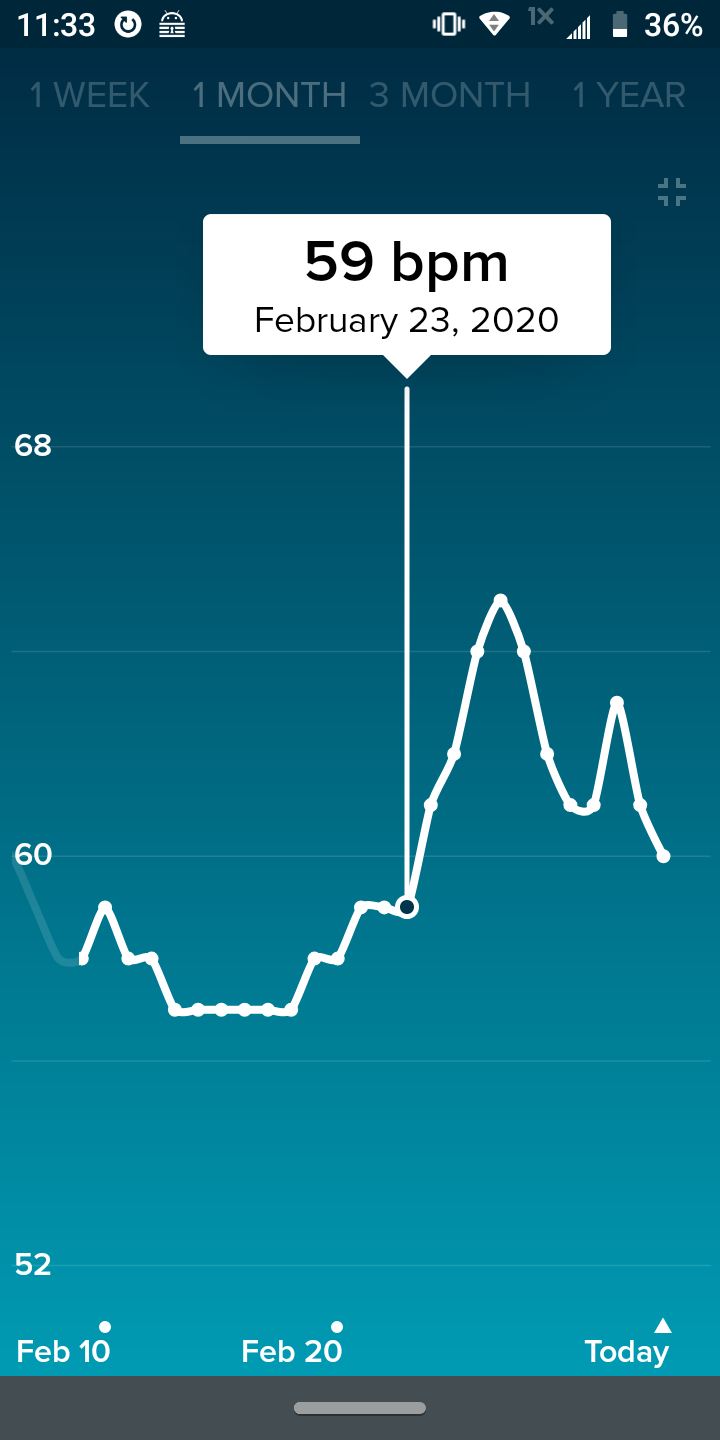
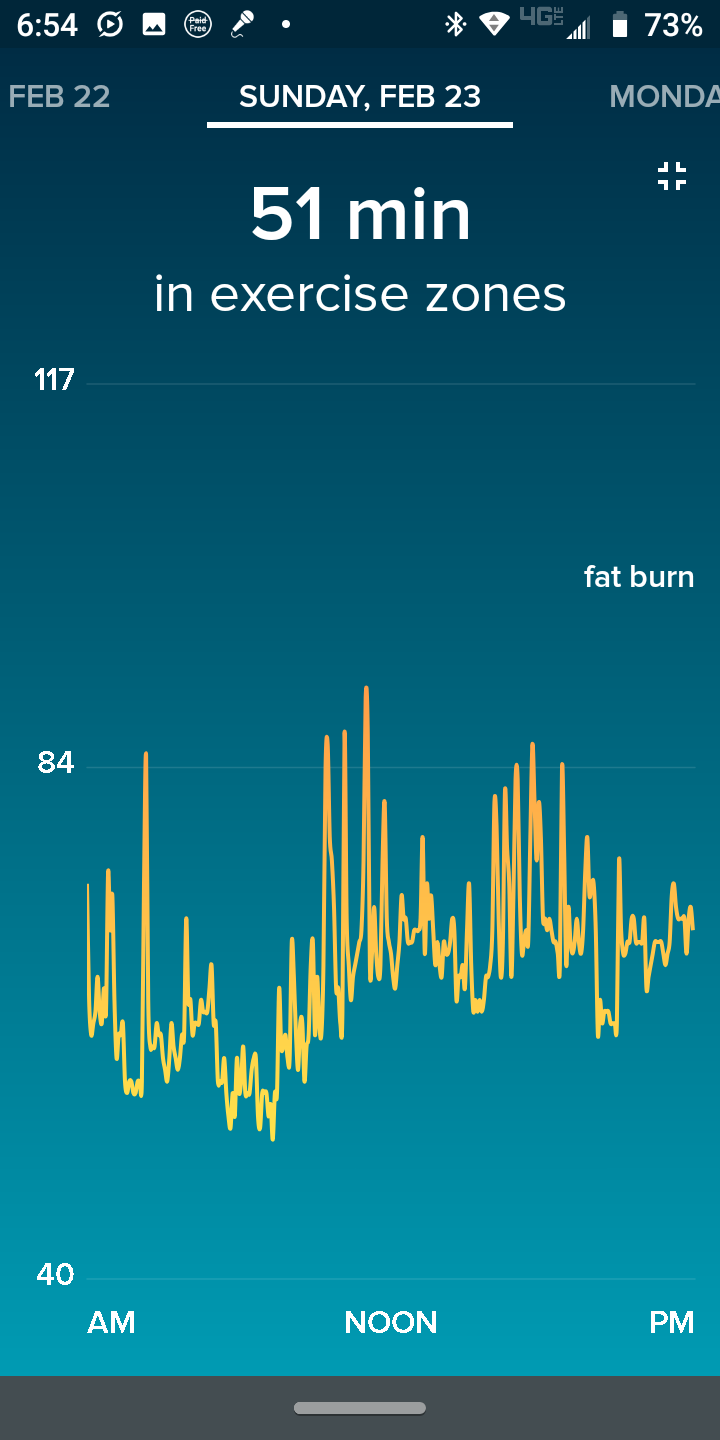
I caught the flu on Sunday the previous week. After a sleepless night I could see a dramatic rise in my pulse on Monday on my Fitbit Alta HR. It scared me too much so I took it off for about 12 hours because it was just TMI.
I am doing much better now and my RHR (or at least Fitbits version of it) is returning to normal.
My pulse did start increasing Sunday from about 60 to 75 beats but the 101F fever didnt really start til Monday.
1 Like
Were you already “feeling under the weather” Sunday, or was the increase in heart rate the first warning sign for you?
My sleep was bad for at least about a week before because I was doing a lot of caregiving for my wife who had painful dental surgery. I also might have picked up the virus at my dad’s assisted living center on that Saturday or Sunday.
The final straw was probably when I caught a bad chill while watching deer in our backyard on Sunday evening. After that I felt pretty lousy and started having some body aches and sinus issues.

My pulse on Sunday actually apparently wasn’t too bad and didn’t really start elevating at rest until Monday when I had the fever.
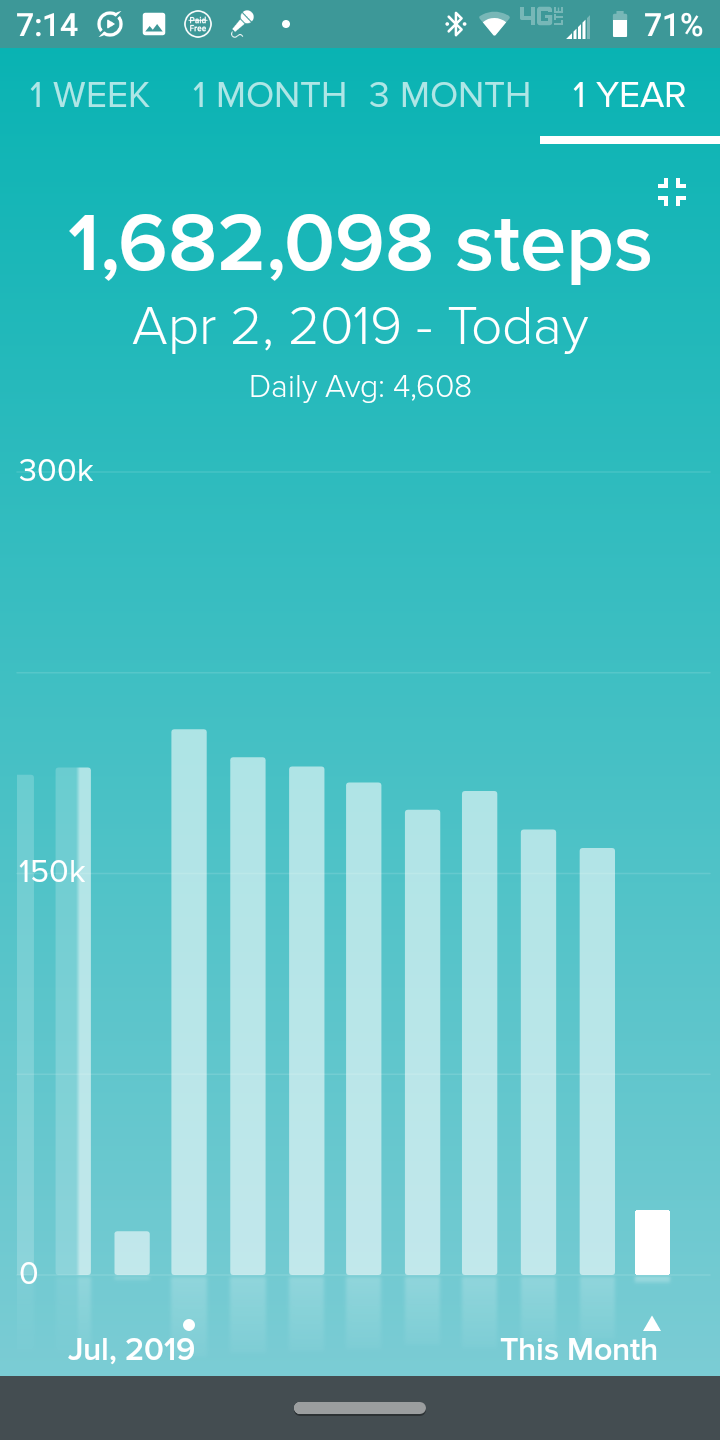
I have been out of shape too because my steps have been declining since July.
1 Like
I’m contemplating on doing this with an apple watch.
And someone pointed me to this post.
Here’s the gist of it. Thoughts?
At the very least, such a project could explore if elevated resting heart rate is in fact an early warning sign for anyone… The key would be to have people not just do resting heart rate measurements, but also take daily temperature readings, track symptoms, and share test results (if any).
Hey @pkuhar, that’s interesting. Over at Open Humans we’re currently looking into how useful such a thing could be! I’ve started exploring my own data a bit more to see how physiological patterns before/after the onset of cold/flu-like symptoms performs. I made a first, reusable jupyter notebook to perform retrospective data analysis based on data from Oura rings.
We’re currently planning out a larger study idea around the use of retrospective data, which would allow to better identify patterns which e.g. your app could use! If that sounds of interest to you, you can join the our slack at http://slackin.openhumans.org/ and come to the #quantifiedflu channel!
1 Like
Here’s a report of someone detecting that they’re sick before they felt it, but based on elevated body temperature (skin?) rather than heart rate:
Thanks @ejain! @madprime and I have made some progress on getting a simple website set up and are currently working on improving it. I also made a quick twitter thread summarizing our state: https://twitter.com/gedankenstuecke/status/1239569576171470855
Is there anyone here that has some Oura or Fitbit data covering the last times they were sick and that would want to give it a try?
Only a week later and we have a working prototype at https://quantifiedflu.org/ 
If anyone gives it a try: Let @madprime and me know what you find!
3 Likes
Nice! I’m curious about body temperature as an early warning sign, and what tips people have for taking daily temperature readings… Might be a while before I can get a thermometer to do my own readings though 
1 Like
I have been tracking temperature (forehead) first thing in the morning and last thing at night. I am also logging PulseOX and HRV in the morning.
How I hold the thermometer and where I scan seems to contribute significantly to the daily variation.
The HRV number is really dependent on breathing during the measurement window.
I am logging all my data in Apple Health.
No symptoms yet that would indicate exposure to the virus.
BTW I think Apple should ask for user authorization to process temperature data and location for public health purposes. I really like what Kinsa Health is doing aggregating their data into a Health Weather Map as an indicator of where the corona virus cases are growing and the benefits of social distancing.
1 Like