Just to update, I found that by consistently taking a relatively short acting beta blocker at the first sign of a bothersome arrhythmia (>2 bothersome episodes within 15 minutes) I could prevent these from developing to a multi-day problem. As of right now, I have <2 per day, often just a barely noticeable episode after getting out of bed and, every so often, one more during the day when I’m tired and/or stressed, and then get startled by something. My theory is (which has some interesting experimental evidence to back it up) is that PVCs are “learned” by the cardiac nerves; that is, PVCs induce more PVCs in a positive feedback loop. I think that by interrupting the PVC episodes with a beta blocker, I tune down the volume on this system, and over time, with consistent treatment, my tendency to have PVCs has diminished. They are infrequent enough that I no longer track them with my One Button Tracker, but I keep the metoprolol at the front of my medicine cabinet and always take it with me when I travel.
I’ve bought 2 devices from Shimmer (EBio and GSR+) and they can collect multiple ECG channels and store raw data on sd card. There is Shimmer ECG, which should be good for tracking arrythmia (I’m also have one, but didnt have luck to catch it on ECG)
I tried various ways to track the arrhythmia, but they were technically very tricky to do with home instrumentation. In the end I gained the most from using four tools in four different ways: The Kardia device from AliveCor, the Zio from iRhythm, a cheap fingertip SpO2 monitor, and the One Button as mentioned above.
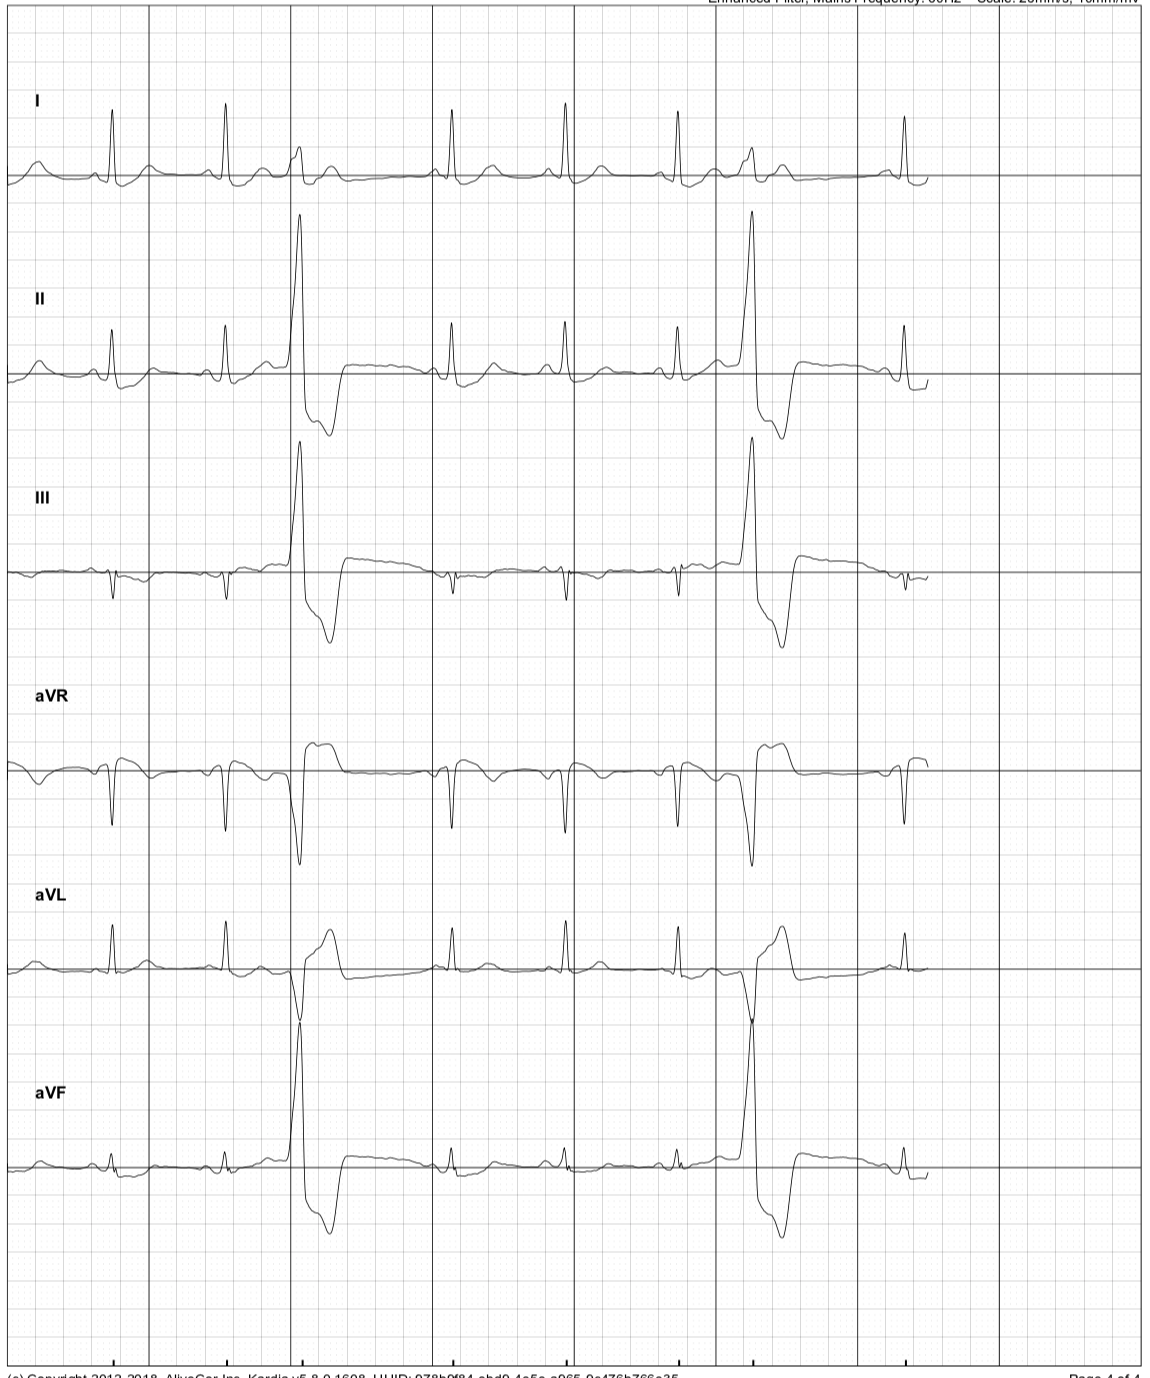
The SpO2 monitor plus the Kardia was very good for seeing the arrythmias as they happened and “tuning in” to the feeling the caused in my chest. The Kardia could deliver a visual graph of the ECG where the PVCs were clearly visible. See below for an example, look at the graph where you would expect to see the 3rd and 6th heartbeat in the sequence:
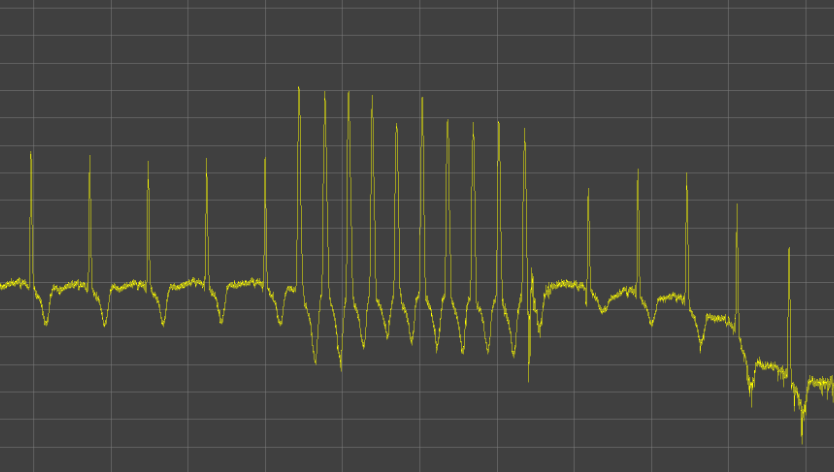
I could also see the missed beats on my fingertip SpO2 monitor:

These two devices helped me be more confident that I knew the feeling of PVCs.
Then, I started tracking with the OBT, over many months, and got to know the pattern of how they came and went. Since I was working with a cardiologist and starting medication, I was prescribed the Zio wearable ECG monitor for two weeks. This gave me a chance to compare my one button data with my Zio data. The Zio recorded a lot more episodes, both because it continued to track at night while I was sleeping, and because I didn’t record every single missed beat but just aggregate “episodes” that I could easily detect. (I didn’t keep pressing again and again once an episode was recorded.) But, even though the Zio had a lot more episodes, my self-collected data and the Zio data were nicely correlated.
Interestingly, to me, is the fact that the most technical devices were most useful for learning and building confidence, while the more “manual” data collection with the OBT was most useful for long term record keeping and analysis. That’s because the technical devices were either expensive, distracting to use, or didn’t allow me to get the data in a convenient way. (The Zio only offered PDFs, the fingertip monitor didn’t produce any digital record, and the Kardia was sort of a marvel but at the same time had both data access issues and required a process that took time.)
In the end, all four were useful in different ways, but the OBT is the only one I continue to use.
Would you mind explaining what you are seeing in the SpO2 for the missed beats?
If you watch the sequence of beats on the fingertip SpO2, notice at about :05, :011, 0:15 (approx) you’ll see no beat when you expect to see one. These coincided with a distinct feeling in my chest, very noticeable. Then, I could look at the Kardia ECG, and see how these skipped beats were represented. They show up quite clearly! This was a form of training for my “introception.”
I’m sorry. I could have been more specific. I was asking look where on the SpO2 device. There are three things to look at visually: the HR number, the % O2 number, and the pulsing bars (further broken down by what the bars are doing–real time pulsing? and whether the HR or O2 are changing).
I have an SpO2 device and previous to this convo I’ve not read on whether the bars are always real-time or a dummy feedback so the user knows the unit is working. Apparently they should be real time. That said, I have seen zero correlation of bar fluctuation or stagnation to normal usage. Or my HR is just odd. I’ll start watching this.
@JohnWick That’s interesting. My pulsing bars corresponded almost exactly to my “feeling of an arrhythmia” and the timing more or less matches what I was able to see when looking carefully at the Kardia device, so I’m confident it is real time. I also watched the SpO2 number, and I didn’t have quite as much confidence about this. I definitely think it is catching very low (for me) SpO2 numbers. During severe episodes when I was missing approximately every 3rd beat for a few minutes running, I would see the SpO2 drop to <94, and I also felt lightheaded. But the smaller fluctuations, from 99 to 96/97, only roughly seemed to match random arrhythmia episodes, and I never felt I could use this signal for very much.
@Agaricus I think it might be interesting for you. I’ve implemented 24/7 ECG collection - from raw data collection (in a comfortable for me way) to visualization and analysis.
As a result of about month of continuous ECG data i have found some arrhythmia (PACs) in my data, they occurs on a daily basis (200-400). Also i have catched paroxysmal tachycardia.
My approach may be adopted to track and quantify other types of arrhythmias and may help in dealing with them.
Raw ECG data from ADC stored in high sampling frequency (512Hz and more if needed) which is a gold standard and can be re-processed/re-calculated in a future if needed. I dont see major difference of data quality compared to scientific studies, so it seems like a good result.
Adding a link to a very interesting report about a PVC tracking project found by @gedankenstuecke:
https://kbroman.org/blog/2024/09/24/premature-ventricular-complexes/
Great find. I had the catheter ablation about 3 weeks ago to deal with A-fib. You can see the lack of a p-wave in the red plots. The ablation went well, and getting back to an active life!
Kyler
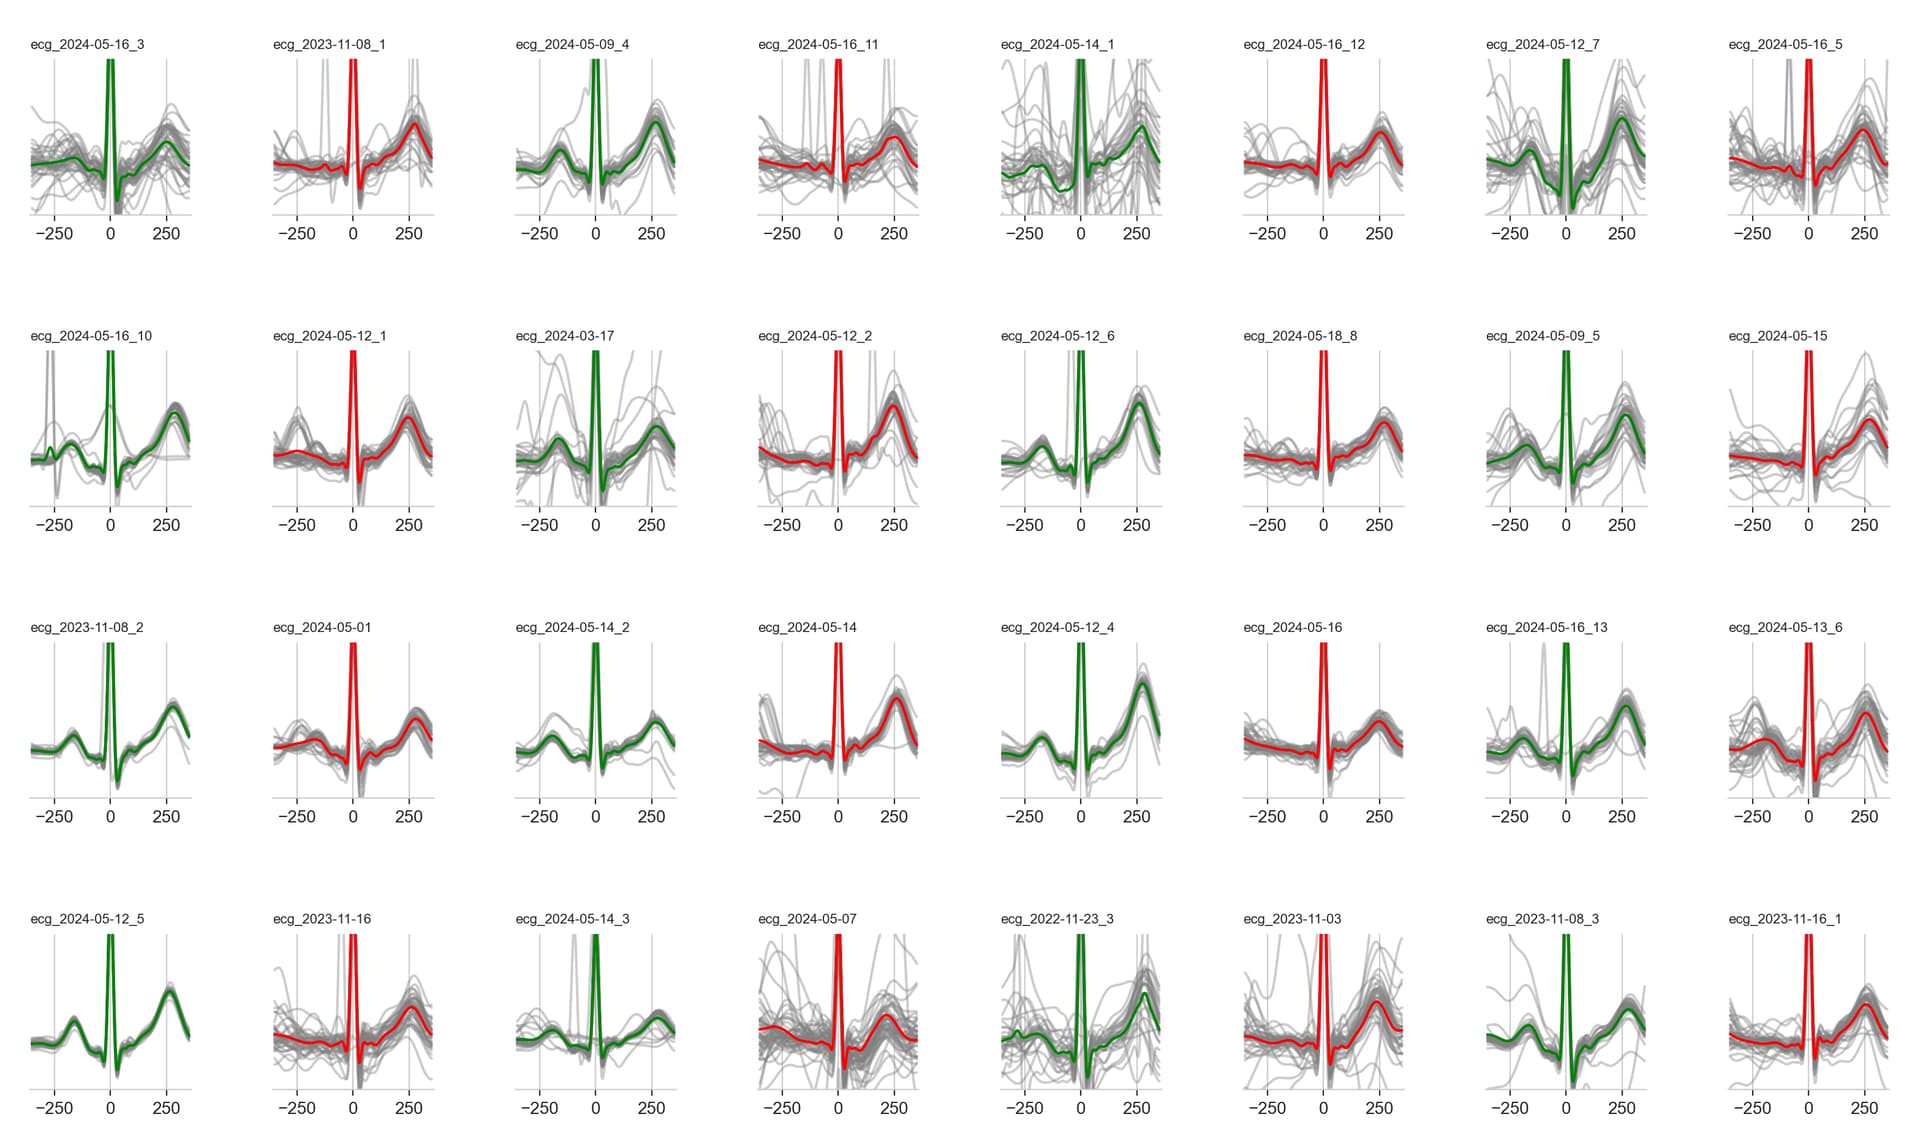
Can you say more about this chart? What does it show? I recognize the wave form, but will you give it some context?
Absolutely. The data was taken from my apple watch (ecg+) at times where I suspected a-fib. Each plot takes the 30-s of waveform, chops it up into individual heartbeats, and overlays them aligning at the peak (the “r” in the qrs complex) with about 300ms on either side. The gray lines are the individual beats in the recording. The green/red is the average for all of them. green=sinus rhythm, red=atrial fib. You can see in the red plots there’s often a lack of a consistent initial hump, called the p-wave, showing atrial depolarization.
Sorry for being a bit cryptic. The author of that post is going through exactly what I did, and is going to have the same procedure. Since he may not actually see this, I may just send a note of support in an email.
What accounts for the pattern of alternating a-fib and no a-fib?
I put the afib (red) and the no-afib (green) side-by-side to see the differences. When I was going through a-fib I collected hundreds of 30s recordings. So, this graph was just designed for exploration purposes.
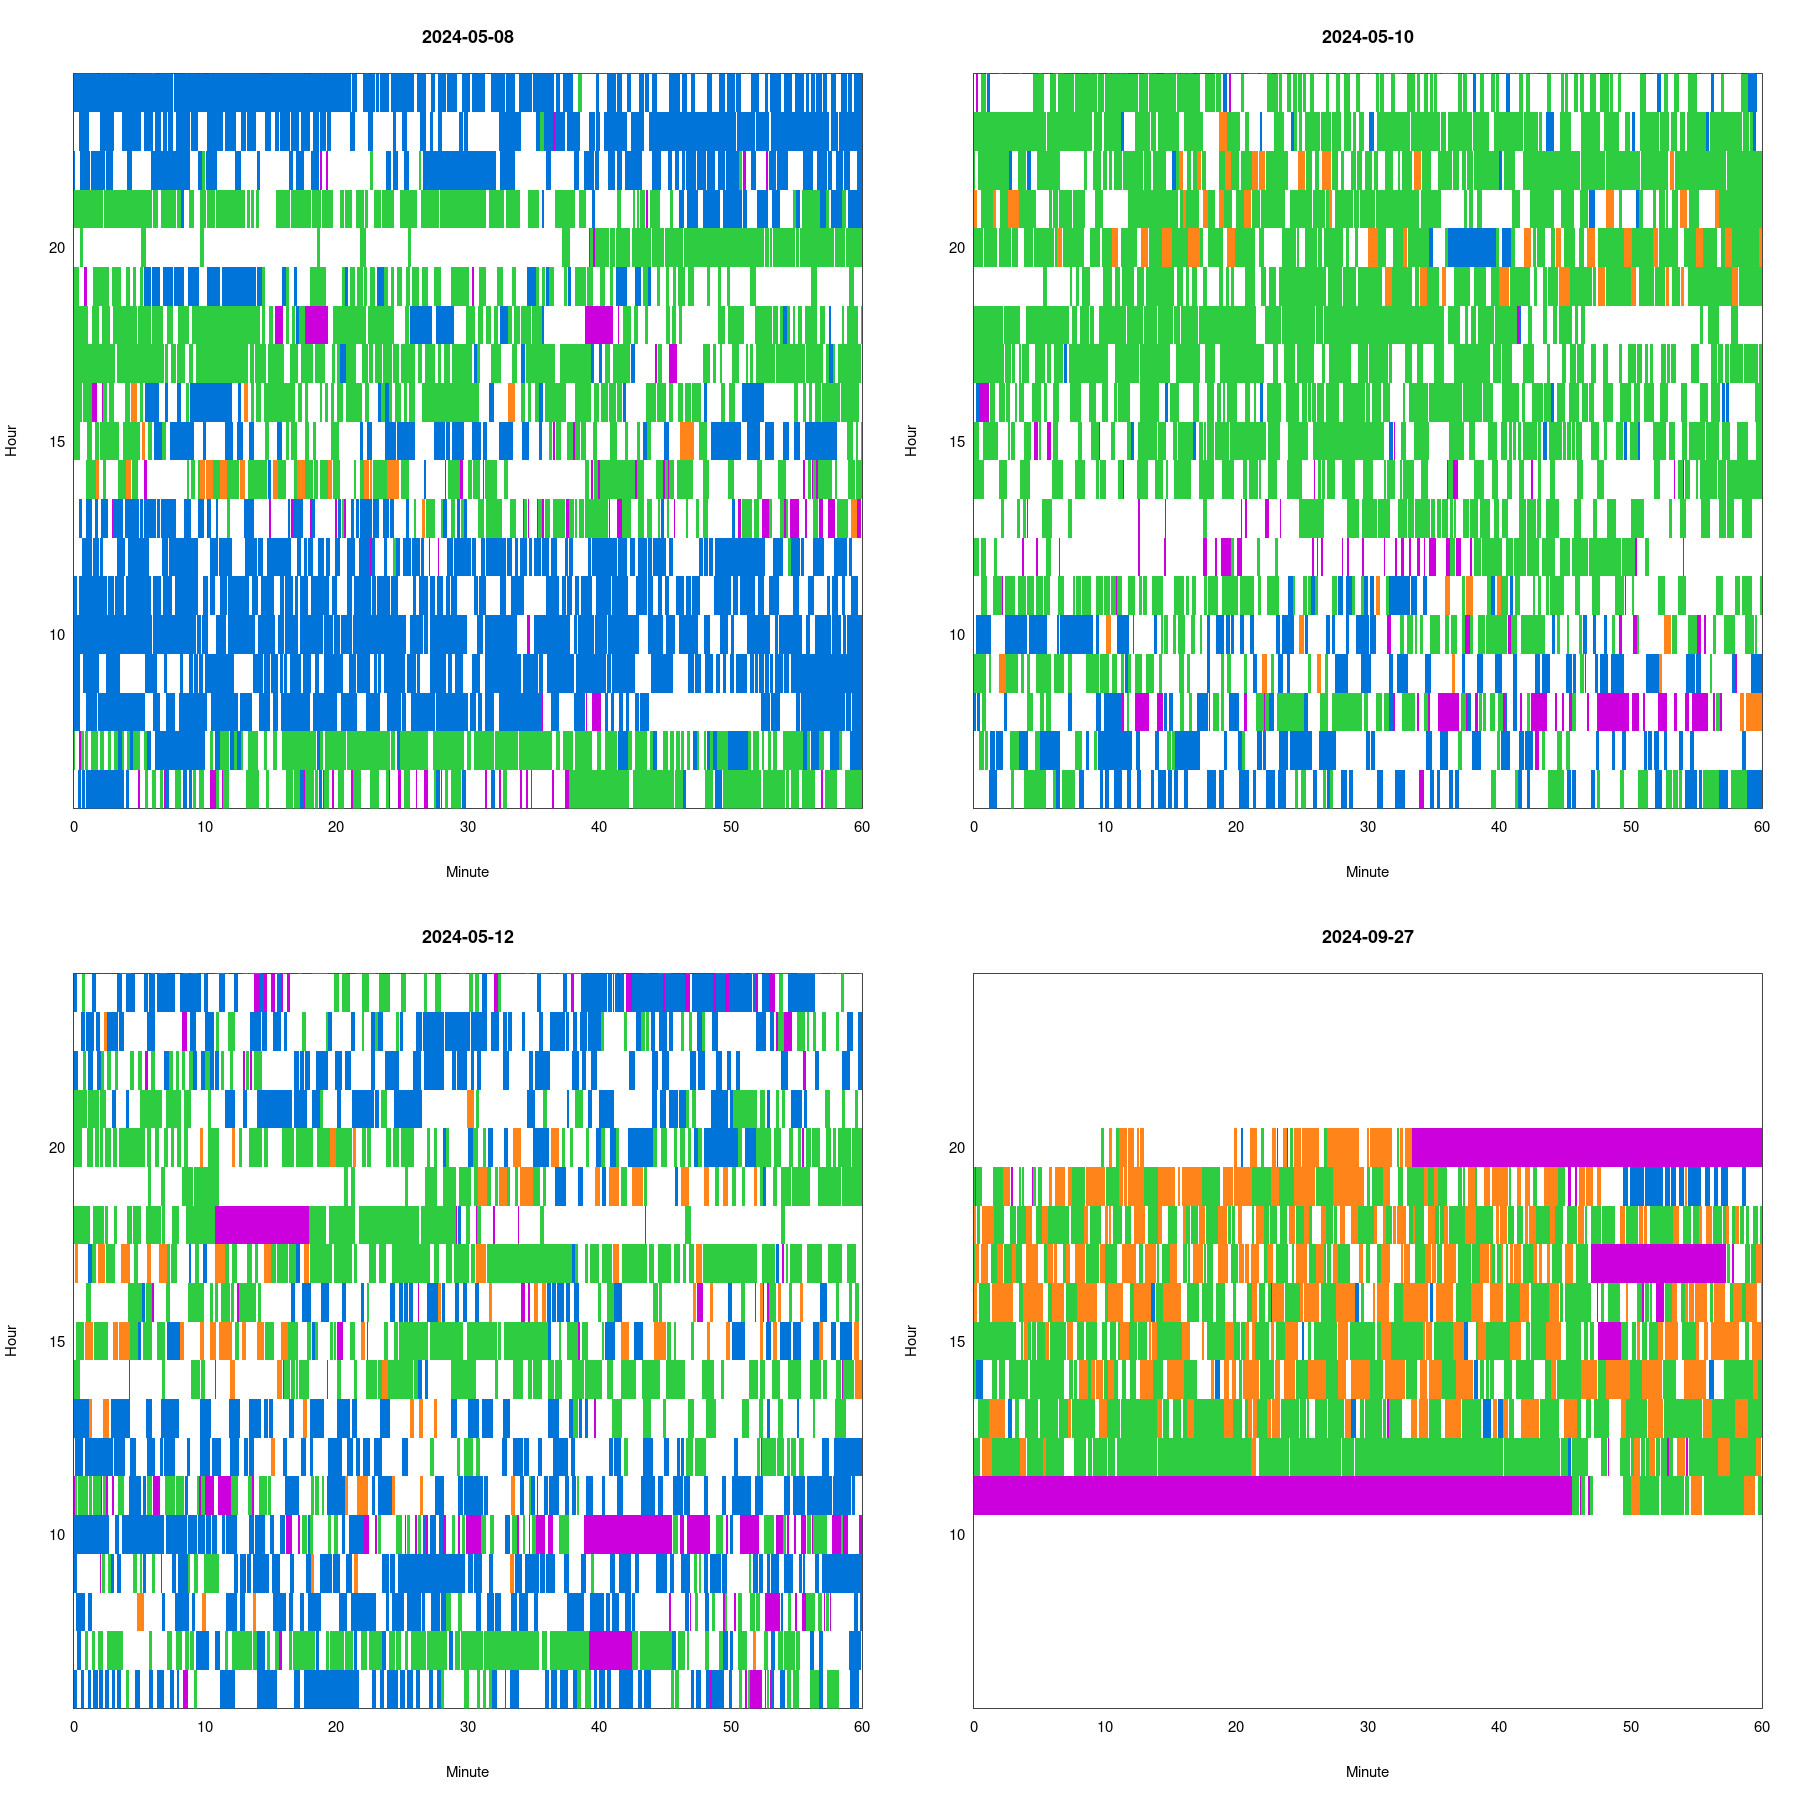
The latest thing I’ve been looking at is classifying stretches of heartbeats as normal, bigeminy (alternating normal/PVC), or trigeminy (every 3rd beat a PVC).
The following figure has four days of data: blue is normal, orange is bigeminy, green is trigeminy, and purple is omitted. White is unclassified.
Yesterday (though with data only from 11:45am to 8:30pm) I noticed a lot of bigeminy and alternation between bigeminy and trigeminy, and so compared it to data from May, 2024 (where I had data from 6am to 1am).
Speaking of ablation, here’s an article that mentions the use of a digital replica of the heart to customize the procedure:
I had my PVC ablation on Wednesday (2024-10-09), and it went well. They went in through both left and right femoral veins to map the PVCs, which were just where they’d predicted based on ECG: the aortomitral continuity (AMC). Went in through femoral artery to ablate using RF, and the PVCs immediately went away.
Recovery has been much easier than I’d imagined. They had me lie flat for 2 hours after the procedure, and then sitting up for another hour, but then I was able to walk out of the hospital. The insertion sites were sore that evening, but no pain at all since. No strenuous activity for a week, but I’m able to walk and take stairs without a problem. I have had a few migraine headaches, which may be a side effect of the anesthesia. (They gave me mild sedation, but I actually fell asleep immediately, before they’d even put the oxygen in my nose, and slept through the whole procedure.)
The PVCs are basically gone. Reviewing 24 hours of Polar H10 data from yesterday (2024-10-11), I did count 160 PVCs (about one every ten minutes), versus the 20k in 24 hours I was having before.
Wow. That’s a great outcome. When I was going through periods of a few thousand per day, I was definitely wondering about doing this. 20K would have had me in for sure. I’m really happy to hear this result.