Sensor applied this morning at about 11:00 am. Really tempted to track what I eat but resisting the temptation since I know it will be distracting and I’ll eventually fail anyway.
2022 On our territory was the year of the final collapse of hopes, the collapse of illusions, losses.
Now the trend to increase the strength of different stresses.
Old methods of protection against stresses are no longer working, need to try new ones.
Health noticeably worsens from many stresses. This is important for so many.
The beginning of arrhythmia coincides with the beginning of the pandemic. Is it right?
How did you survive the storm?
Does this include “intentional” sudden stress (like a cold shower, or sudden events in a movie)?
Health noticeably worsens from many stresses.
I do think more stress = more arrhythmia generally, but they sometimes worsen when I don’t think I’m especially stressed.
The beginning of arrhythmia coincides with the beginning of the pandemic. Is it right?
No, it has been happening since about 2016.
How did you survive the storm?
We survived, though there was a power outage, and now there is another one!
Does this include “intentional” sudden stress (like a cold shower, or sudden events in a movie)?
Typically no. An argument, a spilled drink or other minor mishap, a noise that wakes me up (like if a car alarm goes off at night) , or raising my hand to speak in a formal setting where I don’t know people well are all typical triggers.
I was actually in the hospital last month for another heart attack.
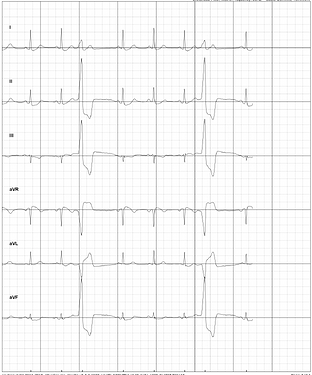
With my heart attacks I have picked up PVCs (premature ventricle contractions), and I am an a lot of heart meds.
While I was hooked up to my continuous ECG, I noticed if I calmed myself enough I could set off the bradycardia (heart rate too slow) alarm (or if I genuinely just relaxed without thinking).
I wouldn’t mind being able to access my own data (the full 12 leads-10 contact version). I can contribute to collecting PVC and bradycardia data pretty regularly, lol.
I found that I couldn’t access my data from the Zio monitor my cardiologist prescribed. I had to hand copy the data from the PDFs.
Sorry to hear about your heart attacks!
That is the same issue that a group of people on a hackathon(currently ongoing) with me had with Kardia Mobile.
I had an iRhythm of some sort as well, I think it was a Zio. The data was sent to me cardiologist to read.
Patient empowerment scares some doctors because they don’t want a lot of people overloading the system. But I think the reactions of people are varied and with good design we can get the metrics (like false positives) down significantly.
Blood pressure machines can be inaccurate, but its still recommended for people to have.
Hi Agaricus,
Some thoughts:
You mentioned cold toes and I am wondering if it is a blood oxygen issue or your body responding to a threat by moving blood flow to the interior. Would monitoring toe temperature and PulseOx at the same time give a clue? I am assuming the pulse would compensate for changes in blood flow but I don’t know if it is possible to get their Automatic Gain Control (AGC) numbers out of the unit while it is computing % oxygen.
Also wondering if the arrhythmia is driven by an electrical signal or a chemical signal to your heart. When I was playing around with HRV measurements I noticed that my beat to beat variation was fairly noisy. It seemed to go sinusoidal when I was doing controlled breathing. Is it possible to detect the start of your arrhythmia on a beat to beat heart rate plot (when doing controlled breathing) and calculate the delay time between the disturbance and the start. I am thinking that electrical signal causes would be much faster than chemical signaling.
Is the magnitude of the arrhythmia event linearly related to the magnitude of the disturbance (say loudness of a car alarm)? Does knowing a noise is coming diminish the number of events?
Good luck.
uECG from ukraine, an open source device was designed in a hackathon. only 2 lead patch. I wore it for a while. Lots of poor signal but when the signal is poor its usualy obvious so what is needed is an app that can remove bad data and aggregate for useful info. https://www.tindie.com/products/ultimaterobotics/uecg-small-open-source-wireless-ecg-sensor/
Just to update, I found that by consistently taking a relatively short acting beta blocker at the first sign of a bothersome arrhythmia (>2 bothersome episodes within 15 minutes) I could prevent these from developing to a multi-day problem. As of right now, I have <2 per day, often just a barely noticeable episode after getting out of bed and, every so often, one more during the day when I’m tired and/or stressed, and then get startled by something. My theory is (which has some interesting experimental evidence to back it up) is that PVCs are “learned” by the cardiac nerves; that is, PVCs induce more PVCs in a positive feedback loop. I think that by interrupting the PVC episodes with a beta blocker, I tune down the volume on this system, and over time, with consistent treatment, my tendency to have PVCs has diminished. They are infrequent enough that I no longer track them with my One Button Tracker, but I keep the metoprolol at the front of my medicine cabinet and always take it with me when I travel.
I’ve bought 2 devices from Shimmer (EBio and GSR+) and they can collect multiple ECG channels and store raw data on sd card. There is Shimmer ECG, which should be good for tracking arrythmia (I’m also have one, but didnt have luck to catch it on ECG)
I tried various ways to track the arrhythmia, but they were technically very tricky to do with home instrumentation. In the end I gained the most from using four tools in four different ways: The Kardia device from AliveCor, the Zio from iRhythm, a cheap fingertip SpO2 monitor, and the One Button as mentioned above.
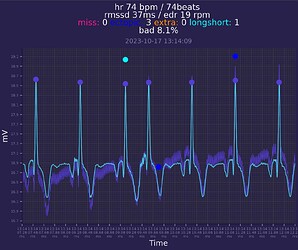
The SpO2 monitor plus the Kardia was very good for seeing the arrythmias as they happened and “tuning in” to the feeling the caused in my chest. The Kardia could deliver a visual graph of the ECG where the PVCs were clearly visible. See below for an example, look at the graph where you would expect to see the 3rd and 6th heartbeat in the sequence:
I could also see the missed beats on my fingertip SpO2 monitor:
These two devices helped me be more confident that I knew the feeling of PVCs.
Then, I started tracking with the OBT, over many months, and got to know the pattern of how they came and went. Since I was working with a cardiologist and starting medication, I was prescribed the Zio wearable ECG monitor for two weeks. This gave me a chance to compare my one button data with my Zio data. The Zio recorded a lot more episodes, both because it continued to track at night while I was sleeping, and because I didn’t record every single missed beat but just aggregate “episodes” that I could easily detect. (I didn’t keep pressing again and again once an episode was recorded.) But, even though the Zio had a lot more episodes, my self-collected data and the Zio data were nicely correlated.
Interestingly, to me, is the fact that the most technical devices were most useful for learning and building confidence, while the more “manual” data collection with the OBT was most useful for long term record keeping and analysis. That’s because the technical devices were either expensive, distracting to use, or didn’t allow me to get the data in a convenient way. (The Zio only offered PDFs, the fingertip monitor didn’t produce any digital record, and the Kardia was sort of a marvel but at the same time had both data access issues and required a process that took time.)
In the end, all four were useful in different ways, but the OBT is the only one I continue to use.
Would you mind explaining what you are seeing in the SpO2 for the missed beats?
If you watch the sequence of beats on the fingertip SpO2, notice at about :05, :011, 0:15 (approx) you’ll see no beat when you expect to see one. These coincided with a distinct feeling in my chest, very noticeable. Then, I could look at the Kardia ECG, and see how these skipped beats were represented. They show up quite clearly! This was a form of training for my “introception.”
I’m sorry. I could have been more specific. I was asking look where on the SpO2 device. There are three things to look at visually: the HR number, the % O2 number, and the pulsing bars (further broken down by what the bars are doing–real time pulsing? and whether the HR or O2 are changing).
I have an SpO2 device and previous to this convo I’ve not read on whether the bars are always real-time or a dummy feedback so the user knows the unit is working. Apparently they should be real time. That said, I have seen zero correlation of bar fluctuation or stagnation to normal usage. Or my HR is just odd. I’ll start watching this.
@JohnWick That’s interesting. My pulsing bars corresponded almost exactly to my “feeling of an arrhythmia” and the timing more or less matches what I was able to see when looking carefully at the Kardia device, so I’m confident it is real time. I also watched the SpO2 number, and I didn’t have quite as much confidence about this. I definitely think it is catching very low (for me) SpO2 numbers. During severe episodes when I was missing approximately every 3rd beat for a few minutes running, I would see the SpO2 drop to <94, and I also felt lightheaded. But the smaller fluctuations, from 99 to 96/97, only roughly seemed to match random arrhythmia episodes, and I never felt I could use this signal for very much.
@Agaricus I think it might be interesting for you. I’ve implemented 24/7 ECG collection - from raw data collection (in a comfortable for me way) to visualization and analysis.
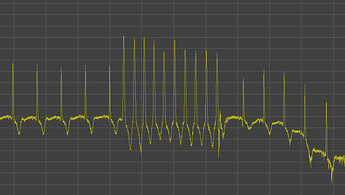
As a result of about month of continuous ECG data i have found some arrhythmia (PACs) in my data, they occurs on a daily basis (200-400). Also i have catched paroxysmal tachycardia.
My approach may be adopted to track and quantify other types of arrhythmias and may help in dealing with them.
Raw ECG data from ADC stored in high sampling frequency (512Hz and more if needed) which is a gold standard and can be re-processed/re-calculated in a future if needed. I dont see major difference of data quality compared to scientific studies, so it seems like a good result.


